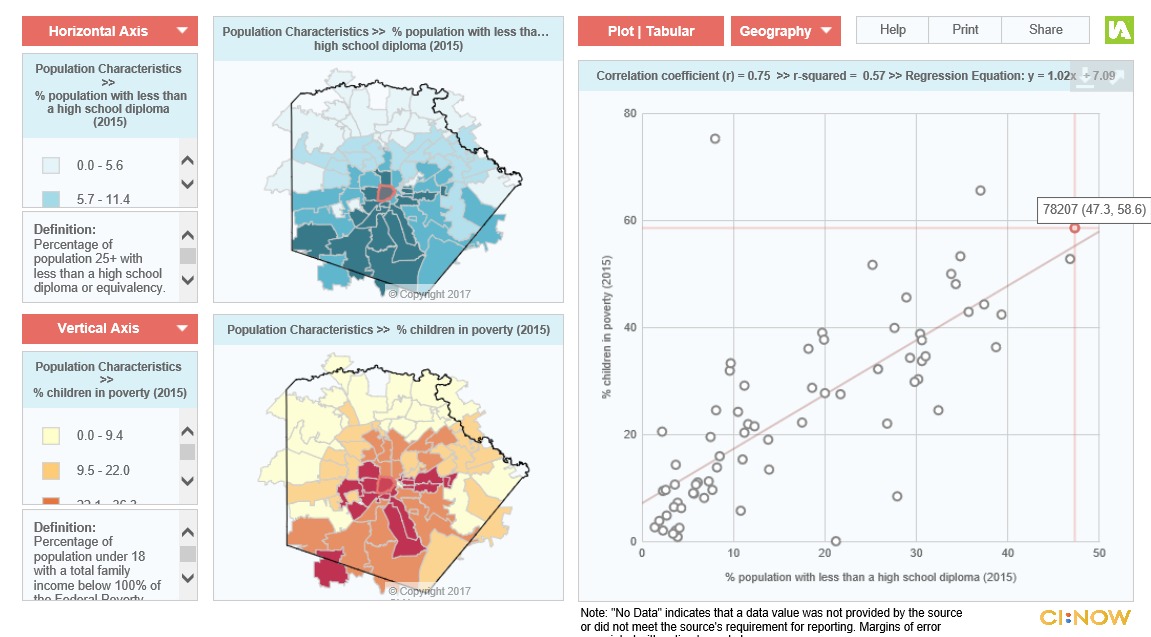
CI:Now just built an interactive scatterplot tool for the United Way of San Antonio and Bexar County. The tool allows the user to explore patterns between issues at the place level – this screen grab shows that zip codes with a higher percent of kids in poverty tend to have a higher percent of adults with less than a high school diploma.

The tool maps any two indicators selected by the user, plots each zip code, and calculates the correlation coefficient between the two indicators. Interested in having a tool like this built for your organization or collaborative? Let us know!
(But speaking of correlations… how about the strong correlation between national per-capita margarine consumption and the divorce rate in Maine? Browse Tyler Vigen’s brilliant collection of Spurious Correlations for a fun reminder to be careful of our assumptions about issues that appear to be associated.)