Search

Our Tools

Find data with CINow’s data tools that connect you with local data for Bexar County and Texas. With user-friendly interfaces and insightful analytics, our tools make trustworthy data quick and easy to find, use, and share to drive positive change and enhance community outcomes.

Bexar Data Dive English/Spanish

Data Dive consolidates Bexar County data on health, demographics, education, economics, and more. Users can explore data by county, census tract, ZIP code, or the new Statistical Small Area (SSA) for easy comparisons across different geographies and groups.

Food Insecurity Data Portal

The portal is a central repository for data on the nature and severity of food insecurity in San Antonio and an analysis of its root causes and health impacts. The content of this page was developed by the research team at the UTHealth Houston School of Public Health: Dr. Ryan Ramphul, Alexander Devora, and Rebecca Hurliman.

ReadyKidSA Coalition Scorecard

CINow annually updates the data for the ReadyKidSA Coalition Scorecard, a dashboard that captures progress on ReadyKidSA‘s goals and helps guide strategy on an ongoing basis. These indicators and data were developed for United Way to help them set the agenda for ReadyKidSA.

Somos Neighbors

Somos Neighbors connects us with each other, with an understanding of the neighborhoods we live in, and with action to close the life expectancy gap. If we work together we can live long healthy lives in the neighborhoods we love, no matter where in the county we live.

ACS Sidekick

Get more out of Census American Community Survey (ACS) five-year estimates by using Sidekick to calculate aggregate estimates and margins of error for non-standard demographic groupings and geographic areas across Texas.

Data Explorer

The Data Explorer allows you to find vetted, trustworthy data by topic, by county, or by special focus area. CINow has pulled this collection of external resources together to make it faster to find good, relevant data and information.

COVID-19 and Existing Disparities

Bexar County’s health disparities are best seen by looking through both a demographic lens (race/ethnicity, sex, age group) and a place lens (census tract, ZIP code tabulation area). Take a look at each section below to learn more about disparities in COVID-19 burden and other community issues.

2020 Census Response Rates Dashboard

The interactive tool displays response rate trends for the county, area cities and towns, and census tracts, comparing current response rates to 2020 goals and the 2010 mail return rate. Built with support from the San Antonio Area Foundation, this tool was launched to help the joint city-county Complete Count Committee (CCC) and others monitor local response rates and finely target outreach strategies.

OMH Grant Progress Dashboard

In late 2021 CINow won a highly-competitive grant from the U.S. Department of Health and Human Services Office of Minority Health to help people in Bexar County access and use data to reduce health disparities and inequities. Learn more about our progress and find published quarterly progress reports here.

External Resources

Data Explorer

The Data Explorer allows you to find vetted, trustworthy data by topic, by county, or by special focus area. CINow has pulled this collection of external resources together to make it faster to find good, relevant data and information.

Access to Health Care in Bexar County During COVID-19

The Access to Health Care in Bexar County During COVID-19 (2023) collaborative report weaves together extant, survey, focus group, and interview data to understand how the pandemic affected access to and utilization of medical, dental, and mental health care.

State of the African American Community

The State of the African American Community in San Antonio and Bexar County (2022) charts data on housing, education, employment and financial stability, business, criminal justice, health, and social connection, followed by community voice and policy recommendations.

Initiatives

Census 2020

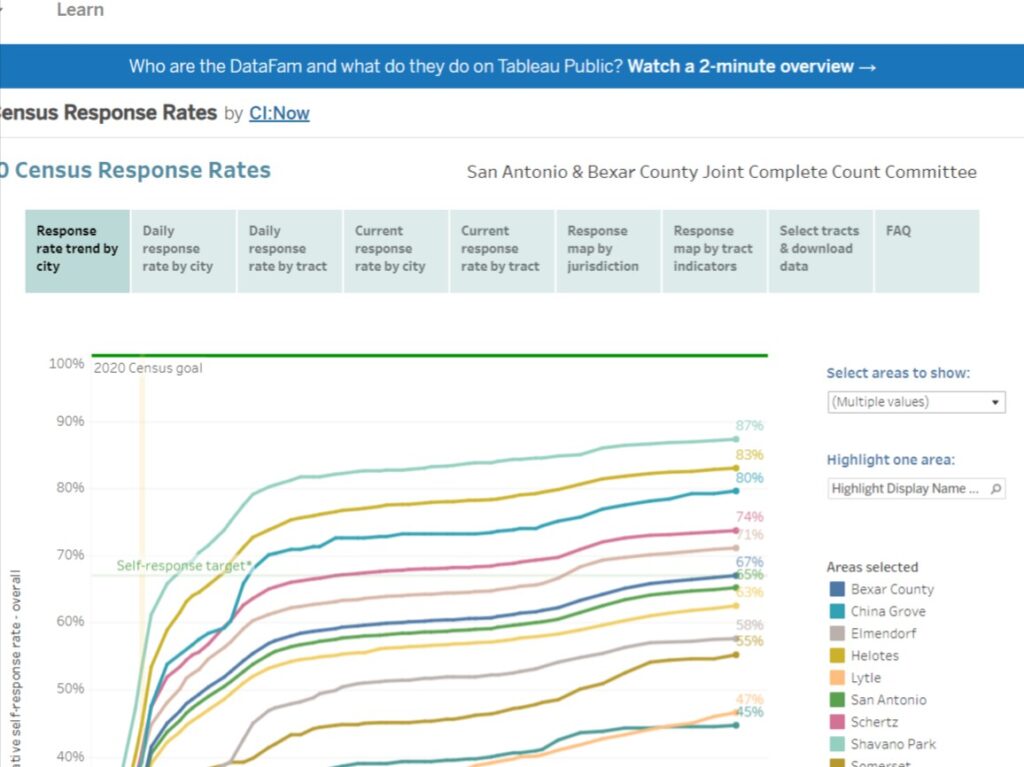
CI:Now’s new Hard-to-Count Map series shows neighborhoods where targeted outreach is likely needed to ensure a complete count. These maps will display not just the Census Bureau-defined hard-to-count areas, but also areas with barriers like low broadband subscription rates and risk profiles like low voter turnout. Click here to see the map in full-screen view.

Contact

We Want to Meet You

Connect with us at CINow to explore the endless ways data can make communities stronger. Whether you have questions, ideas, or a potential partnership in mind – we want to be of service to you.

PO Box 8149 San Antonio, TX 78208