What’s the news?
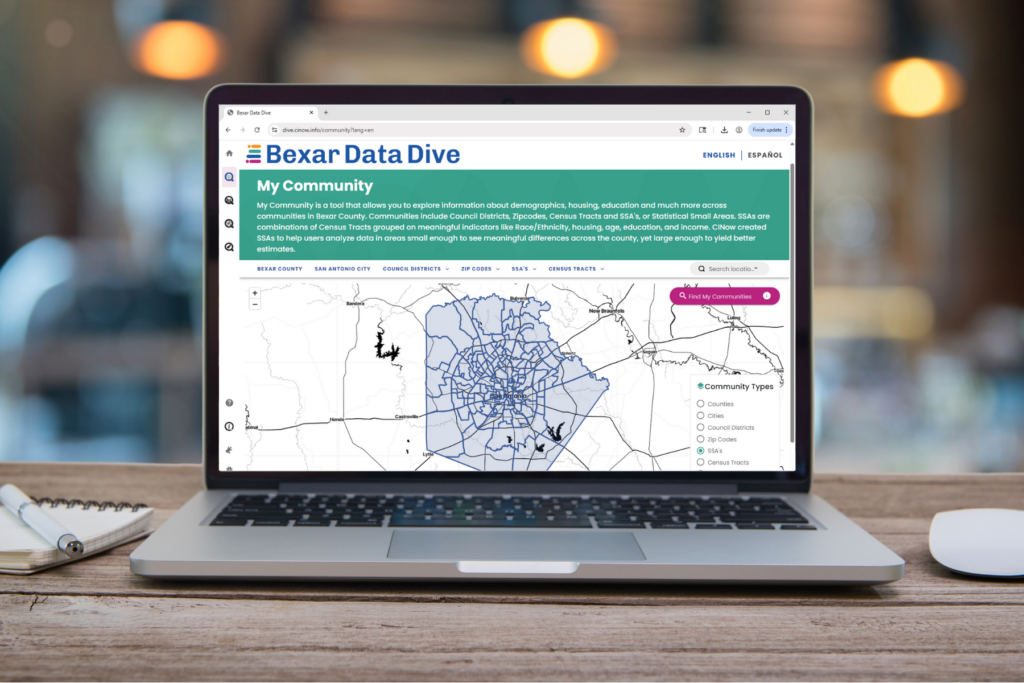
Community Information Now (CI:Now), a San Antonio-based nonprofit local data intermediary housed at the UTHealth Houston School of Public Health in San Antonio, has just launched the beta version of a powerful new tool to help people find and use data about community conditions in Bexar County.
Called Bexar Data Dive and accessible online at dive.cinow.info, the platform:
- Is built to be easy to use but very powerful
- Pulls together local data on a wide range of issue areas, including health, demographic, civil and social, education, economic, housing, criminal justice, environmental, and transportation indicators
- Allows the user to explore data (if available) by county, census tract, ZIP code, or a new census tract-based geography called Statistical Small Area (SSA); and to break out that data by race/ethnicity, age group, and sex
- Makes it easy to compare different geographies and groups, such as race/ethnicity groups
One of just two awards made nationwide, in late 2021 CI:Now won a three-year grant from the U.S. Department of Health and Human Services Office of Minority Health to help people in Bexar County access and use data to reduce health disparities and inequities. In addition to supporting development of the data platform itself, the grant also supports outreach, training, and technical assistance to help people understand and use the data.
Bexar Data Dive works best on a larger screen such as a desktop PC or laptop. A Spanish-language version of the site will be launched in winter 2022, and new feature development and data additions are ongoing.
Who’s involved?
- CI:Now, the project lead, is a nonprofit local data intermediary that provides data, tools, analysis, and training to inform decisions to improve Texas communities, focusing primarily on Bexar and surrounding counties. Since 2008 CI:Now has contracted its core staffing through a powerful community-academic partnership with the University of Texas Health Science Center at Houston (UTHealth Houston) School of Public Health in San Antonio.
- The Health Collaborative is a robust network of citizens, community organizations, businesses, and health care providers working together to improve the health status of the community. THC is responsible for the comprehensive local community health needs assessment and the community health improvement planning process.
- The San Antonio Metropolitan Health District (Metro Health) is the public health agency charged by State law, City code, and County resolution with the responsibility for public health programs in San Antonio and unincorporated areas of Bexar County. Although it is a City/County organization, Metro Health is operated as a City of San Antonio department.
- The City of San Antonio Information Technology Services Department (COSA ITSD) is the centralized office that provides technology direction and oversight for the all of the City’s services and departments. COSA ITSD provides secure, reliable and responsive enterprise-level technology and business solutions that facilitate and enhance the City’s effectiveness in serving the citizens of San Antonio and align with the City’s goals.
- Data Driven Detroit (D3). D3, like CI:Now a partner in the National Neighborhood Indicators Partnership (NNIP), is the local data intermediary in Detroit, Michigan and a national leader in the field. D3 provided consultation and technical assistance in user-centered design of the data platform.
- Community residents. Many local residents co-designed Bexar Data Dive with us through a User-Centered Design process, giving their time and thoughtful input in design focus groups and interviews, survey responses, and beta testing sessions.
How does data help?
San Antonio and Bexar County, Texas shoulder stark racial/ethnic health disparities underpinned largely by inequities in social determinants of health (SDOH). Bexar County has a majority-minority (72%) population whose demographic trends are widely accepted as foretelling national demographic shifts.
While data alone cannot solve any problem, local government, philanthropy, health and human service providers, grassroots advocacy and mutual help organizations, the faith community, and others need good data that shines a light on what those disparities are, what people and neighborhoods shoulder the greatest burden, the disparity severity and trend, and contributing factors, which may vary in nature and degree among different people and neighborhoods. Further, good data can expose important disparities by sex, age group, and income level within any racial/ethnic group. It can identify issue intersections that call for stronger cross-sector collaboration and systems change.
Why this project?
In 2016 CI:Now developed a framework called “What’s Needed for a Community to be Good at Using Data?” That framework identifies seven conditions that must be widespread for a community to use data effectively:
- A culture of valuing data;
- Data literacy;
- Processes and structures to support data use and communication;
- Good data management practices;
- Access to data;
- Access to help in using data effectively; and
- Collaborative and continual planning and action to build local capacity to use data.
Although no single project can by itself establish strong community data capacity, it can shore up weaknesses and build on existing strengths. While a wealth of data is available online, it is usually not broken down in ways that make it powerful and practical. Even assuming data access, the San Antonio-area community is held back by three factors that can be tackled through the project: low data literacy, lack of processes and structures to support data use and communication, and lack of help in using data.
What difference will it make?
The project will produce four concrete and measurable results that will directly support work to reduce and eliminate health disparities and inequities.
- Better disaggregation by race/ethnicity and place. The San Antonio metro area is consistently identified as one of the most highly economically-segregated in the country, but racial/ethnic segregation is much less pronounced. In many communities, high racial segregation means that geography can often be used as a proxy for race/ethnicity, but that method fails in San Antonio and Bexar County. Many disparities and inequities remain hidden unless data can be sliced by both race/ethnicity and place – we need much better information than just a county average. Unfortunately, data “sliced” at the census tract level or lower falls apart due to wide margins of error in survey estimates, data suppression to protect privacy, and volatile rates. Larger ZIP codes are commonly used but meaningless in most cases. To help solve that problem, with community input this project will develop super-neighborhoods based on census tracts that better reflect real neighborhoods than ZIP codes do.
- Better data integration. While CI:Now holds a tremendous amount of data, some published via online data tools and some through reports commissioned by partners, that data is not integrated and cannot be accessed using a single tool. There is currently no way for someone to find and acquire whatever local data is available for a specific neighborhood or for a specific population group.
- Better ease of access. The project will maximize access to the data holdings for both entry-level and advanced users. By creating two site “front doors” developed through user-centered design processes, CI:Now will help ensure that users of all skill levels have easy data access.
- Better supports for data access and use. CI:Now will develop training and supports for using the platform itself, data literacy training to help people understand data, and more tailored supports to help people think about how to apply data to decrease health disparities and SDOH inequities.
What are Statistical Small Areas (SSAs)?
The San Antonio metro area is consistently identified as one of the most highly economically-segregated in the country, but racial/ethnic segregation is much less pronounced. Many disparities and inequities remain hidden unless data can be sliced by both race/ethnicity and place. Unfortunately, data thus disaggregated at the census tract level or lower falls apart due to wide margins of error in survey estimates, data suppression to protect privacy, and volatile rates. ZIP codes, which are quite a bit larger than census tracts, are commonly used but are meaningless in terms of anything except efficient mail delivery.
To help solve that problem, CI:Now created SSAs: clusters of census tracts that better reflect real neighborhoods than do ZIP codes. More information about the methods used to define SSA boundaries can be found in Bexar Data Dive’s FAQ section.
How can I keep up with project progress?
For updates on new features, new data, and training opportunities, subscribe to our newsletter and follow us on social media:
Who do I contact for more information right now?
The best way to get in touch with us is via our contact form.
This project is supported by the Office of Minority Health of the U.S. Department of Health and Human Services (HHS) as part of a financial assistance award totaling $750,000 with 100 percent funded by OMH/OASH/HHS. The contents are those of the author(s) and do not necessarily represent the official views of, nor an endorsement by, OMH/OASH/HHS, or the U.S. Government. For more information, please visit www.minorityhealth.hhs.gov.


