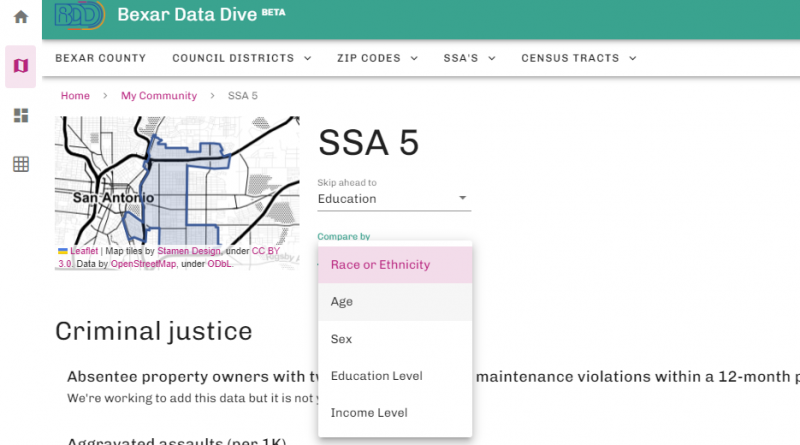
We’ve launched a new feature in Bexar Data Dive‘s My Community report! My Community is the simplest, fastest way to grab all the data we have about the county, a zip code, an SSA, or a census tract – just click on My Community and choose your geography for a full report on that geography’s population.
Now, though, you can use the new “Compare by” menu to generate all the data broken out (disaggregated) by race/ethnicity, age, sex, educational attainment, education level, and/or income level, depending on what’s available from the data source. You’ll still find the data (number, percent, rate) for the total population right next to the indicator name, and you’ll see the breakout in the bar chart beneath it. (Did you know you can click on the green square “i” icon beside the total-population figure to see the definition of the indicator?)
The screenshot below shows that an estimated 62% of young children, 44% of older children, and 23%-25% of adults and older people in SSA 5 live in poverty, with an all-age poverty rate of 31%. For reference, the poverty rate in Bexar County as a whole is 16% overall, 25% among young children, 21% of older children, and 12%-16% among adults and older people.
Find more: SSA 5 | Bexar County