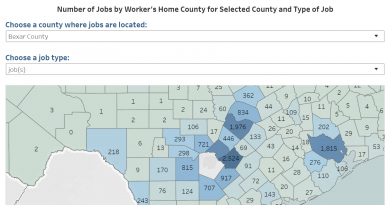
Individual Choices, Connected Lives infographic and interactive map released
Texas’ stay at home order in response to COVID-19 expires April 30 and a phased “reopen” begins. What happens now?
MoreTimely and trustworthy local data
Texas’ stay at home order in response to COVID-19 expires April 30 and a phased “reopen” begins. What happens now?
MoreCI:Now’s 2020 Census Response Rates interactive online tool was mentioned in an April 17 San Antonio Express-News editorial about lagging
MoreOn behalf of the joint city-county Complete Count Committee (CCC), CI:Now has launched a new online data tool to help
MoreCI:Now’s Paulina Cano McCutcheon presented on the new Somos Neighbors tool at the April 2020 Community Health Worker Summit hosted
MoreSeveral media outlets picked up CI:Now’s infographic estimating the lives saved and hospitalizations prevented by our staying home 7, 18,
MoreWe’ve just published the first in a series of COVID-19-related analyses, infographics, and maps: an infographic about the lives we’ve
More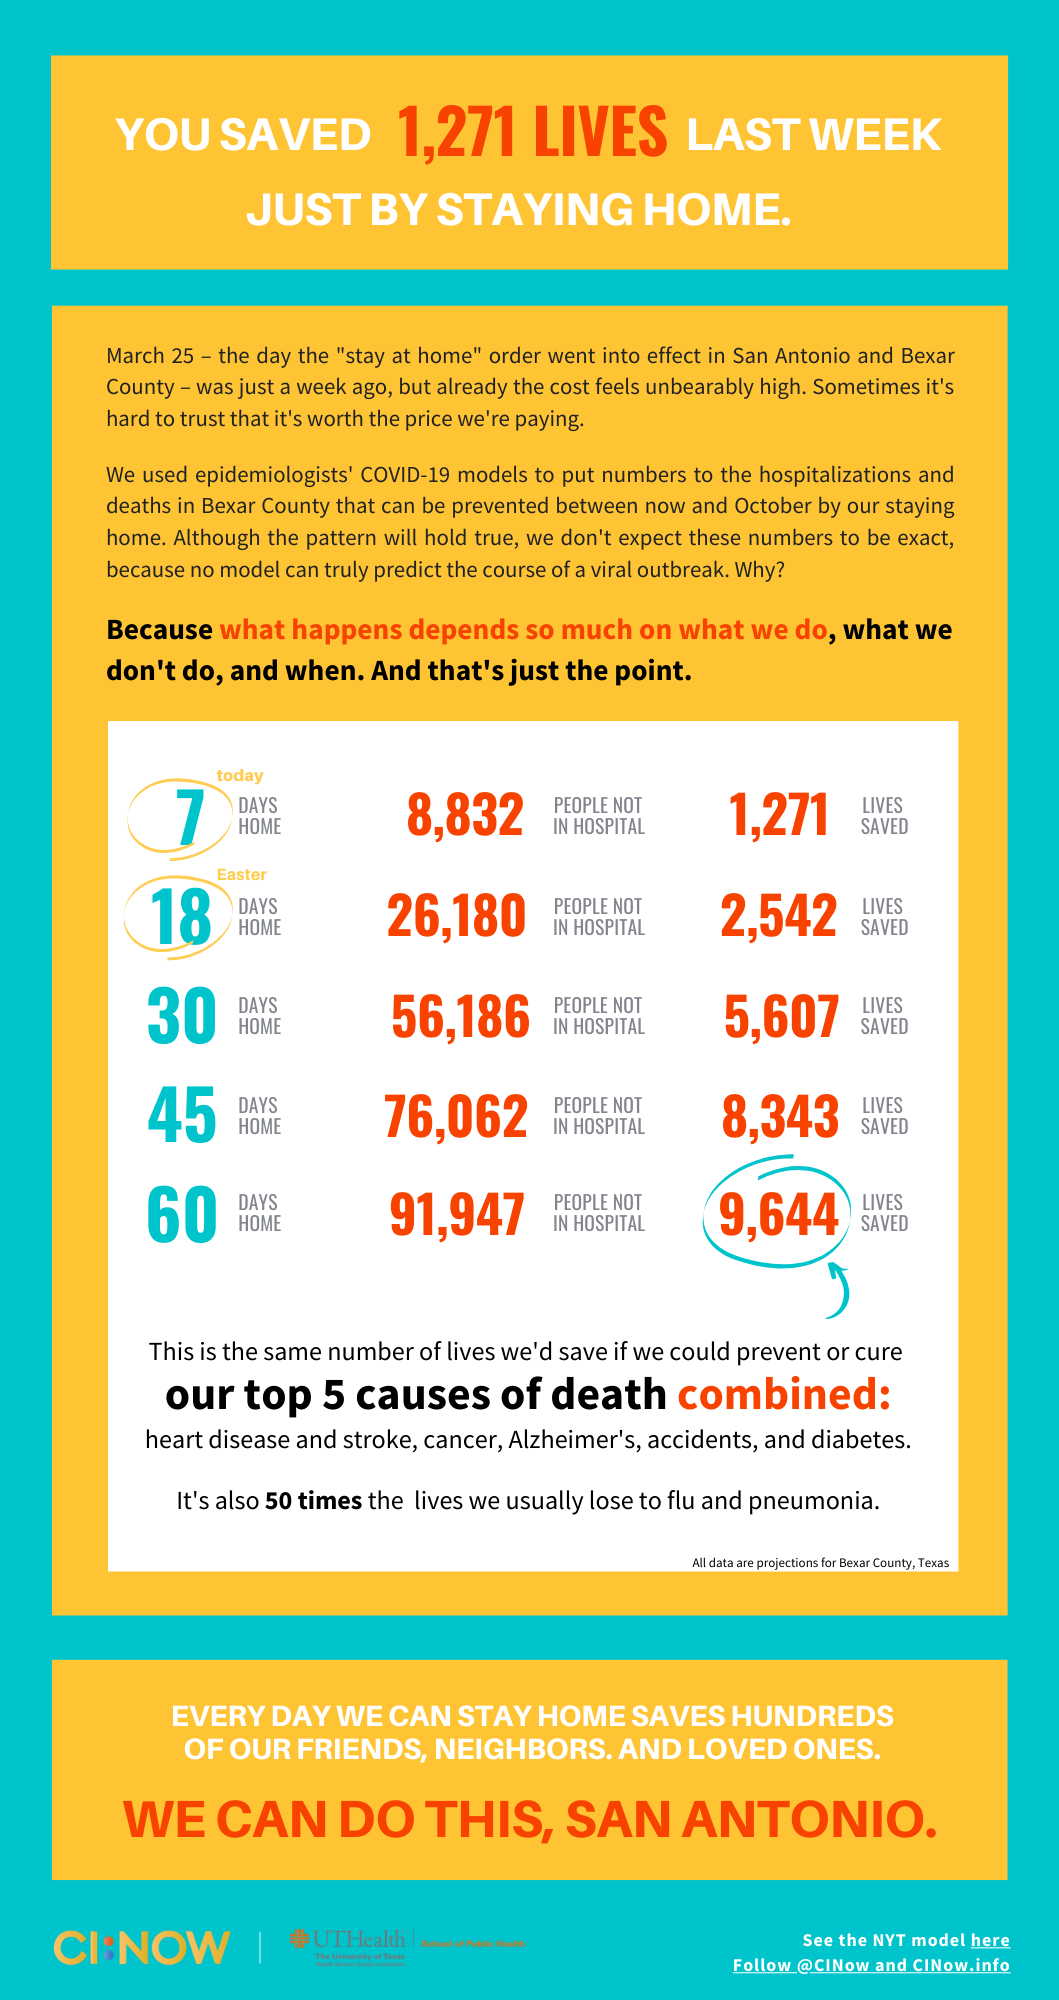
March 25 – the day the “stay at home” order went into effect in San Antonio and Bexar County –
MoreSeveral media outlets covered the launch of CI:Now’s Somos Neighbors platform: What is the life expectancy in your neighborhood and
MoreWhere we live plays a role in how long we live, and average life expectancy in Bexar County’s longest-lived neighborhoods is 18
MoreThe National Neighborhood Indicators Partnership featured CI:Now’s work with the United Way of San Antonio and Bexar County in a
More