2020 Census Response Rates Dashboard
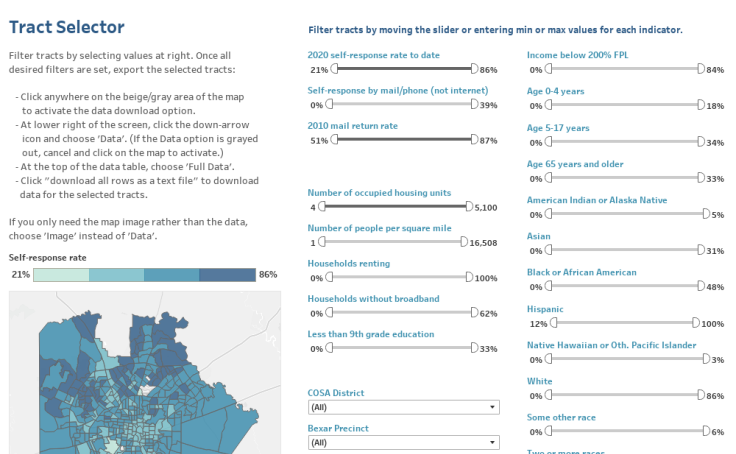
The interactive 2020 Census Response Rates tool displays response rate trends for the county, area cities and towns, and census tracts, comparing current response rates to 2020 goals and to the 2010 mail return rate. The Tract Selector allows anyone to select and download data for census tracts meeting user-set criteria for jurisdiction (City Council District, County Commissioner Precinct, unincorporated areas, Texas House District, and Texas Senate District) and many indicators of risk of undercount.

Data to Inform Outreach
How close are we to a complete count?
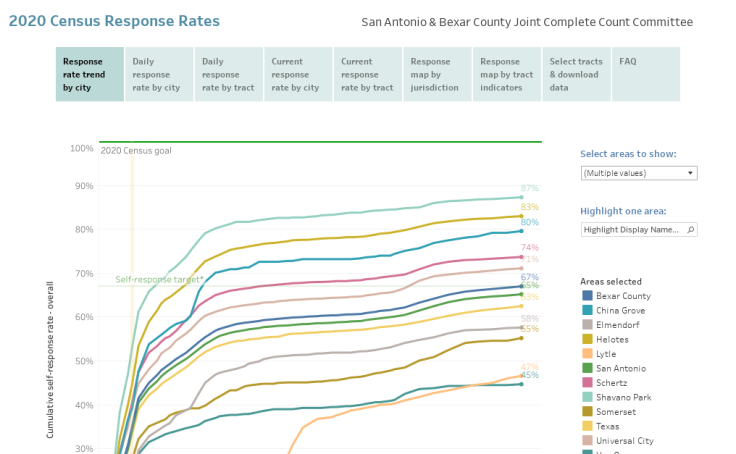
On behalf of the joint city-county Complete Count Committee (CCC), CINow has launched a new online data tool to help the CCC and others monitor local response rates and finely target outreach strategies. Place-based data has become even more critical as the CCC was forced to shift the initial “high-touch” strategy in response to the COVID-19 pandemic, meaning that community-based partners like nonprofits and churches could no longer rely on in-person interaction with participants.
The interactive 2020 Census Response Rates tool displays response rate trends for the county, area cities and towns, and census tracts, comparing current response rates to 2020 goals and to the 2010 mail return rate. The Tract Selector allows anyone to select and download data for census tracts meeting user-set criteria for jurisdiction (City Council District, County Commissioner Precinct, unincorporated areas, Texas House District, and Texas Senate District) and many indicators of risk of undercount.
Where do our “hard-to-count” community members live?
CINow’s new Hard-to-Count Map series shows neighborhoods where targeted outreach is likely needed to ensure a complete count. These maps will display not just the Census Bureau-defined hard-to-count areas, but also areas with barriers like low broadband subscription rates and risk profiles like low voter turnout.
The Response Area Outreach Mapper (ROAM) shows in dark blue those neighborhoods where our community is least likely to respond to the Census. Learn more about the data behind ROAM here.
CINow developed the 2020 Census Response Rates tool with funding from the John L. Santikos Charitable Foundation, a fund of the San Antonio Area Foundation
CINow was one of four organizations selected for a grant from the John L. Santikos Charitable Foundation, a fund of the San Antonio Area Foundation, to support the work of the joint city-county 2020 Census Complete Count Committee. The $50,000 award to CINow funded data to inform the targeting of outreach strategies, monitoring progress and adjusting strategies accordingly, developing technology to help the CCC and its partners award small grants, and communicating outreach efforts among the CCC and general public. Check out the publicly-available 2020 Census data tools CINow has built to date.
What does it do?
Contact
We Want to Meet You!
Connect with us at CINow to explore the endless ways data can make communities stronger. Whether you have questions, ideas, training needs, or a potential partnership in mind – we’re happy to hear from you!