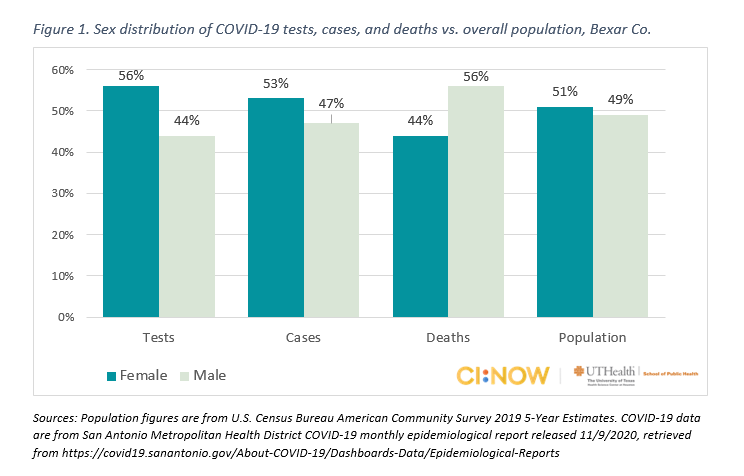
The following charts summarize key COVID-19 disparities by sex, age group, and race/ethnicity. Ideally, comparisons across groups and geographies would use age-adjusted mortality rates to account for differences in the age structure of each group and geography, but the detailed data to calculate those rates is unavailable at this time. Drawing from San Antonio Metropolitan Health District analyses published in November 2020, the following charts visualize disparities by comparing the distribution or breakdown of COVID-19 indicators by sex, age group, and race/ethnicity with the distribution in the general population.
Main points:
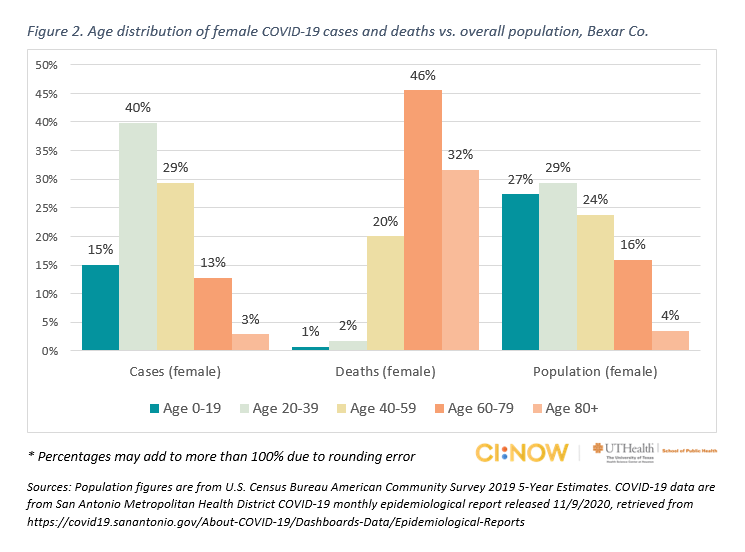
The female population of Bexar County is 27% aged 0-19, 29% aged 20-39, 24% aged 40-59, 16% aged 60-79, and 4% aged 80 and older.
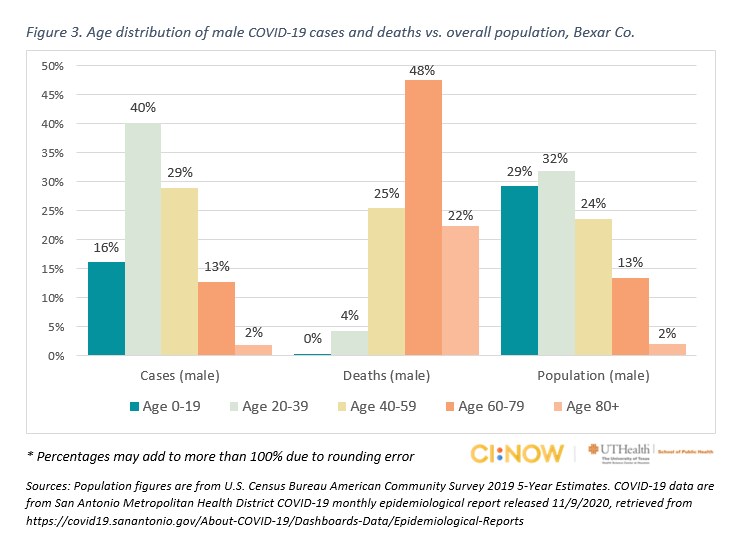
The male population of Bexar County is younger than the female population, with 29% aged 0-19, 32% aged 20-39, 24% aged 40-59, 13% aged 60-79, and 2% aged 80 and older.
Main points:
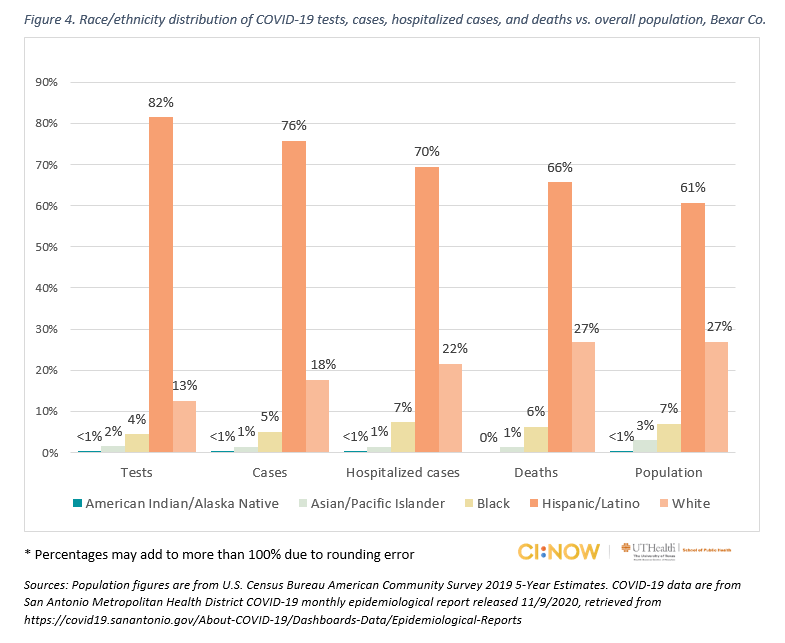
The population of Bexar County is about 0.2% American Indian or Alaska Native, 3% Asian or Pacific Islander, 7% Black, 61% Hispanic, 27% white, and 2% other race or multiple races. COVID-19 data is not available for the other/multiracial category.
Main points:
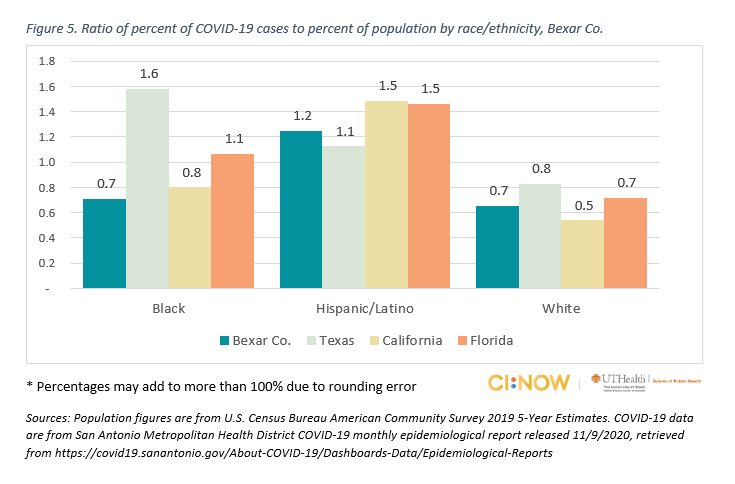
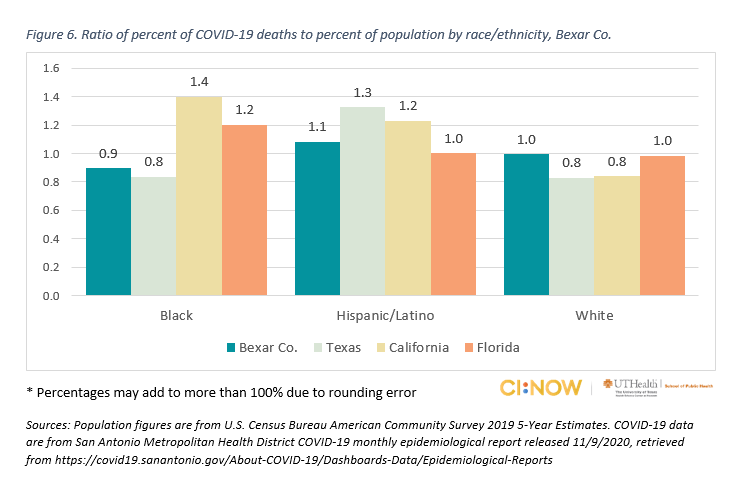
The charts in this section create a measure of disproportionality or disparity by relating race/ethnicity distribution of cases and deaths to race/ethnicity distribution of the overall population. A ratio of 1.0 means that a race/ethnicity group makes up the same proportion of cases (or deaths) as the overall population. The lower the ratio, the more under-represented the race/ethnicity group is compared to the overall population. The higher the ratio, the more over-represented the race/ethnicity group is compared to the overall population.
Main points: