Watch Now
0:20
0:29
0:30
0:40
3:33
4:27

1:15
2:28
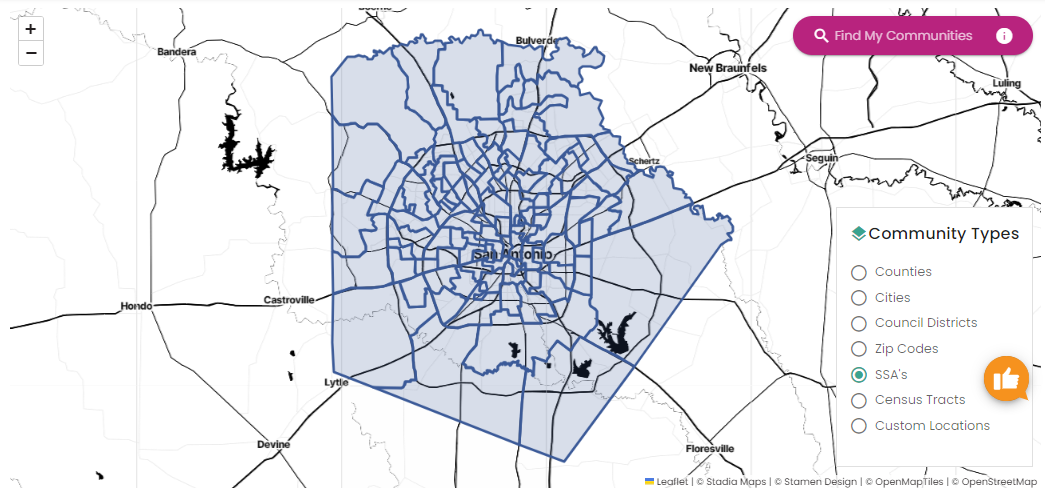
New feature alert! Use the new “Find My Communities” search bar to find what communities an address belongs to (Council District, SSA, Census Tract and Zip Code). Simply type in an address in the pink “Find My Communities” search bar at the top right of the map on the “My Community” tool. A window will pop up with a list of the communities this address belongs to. Each community will have a link to view it in the “My Community” tool and you can use the download button at the top right to save this list for future reference.
DIVE IN NOW!
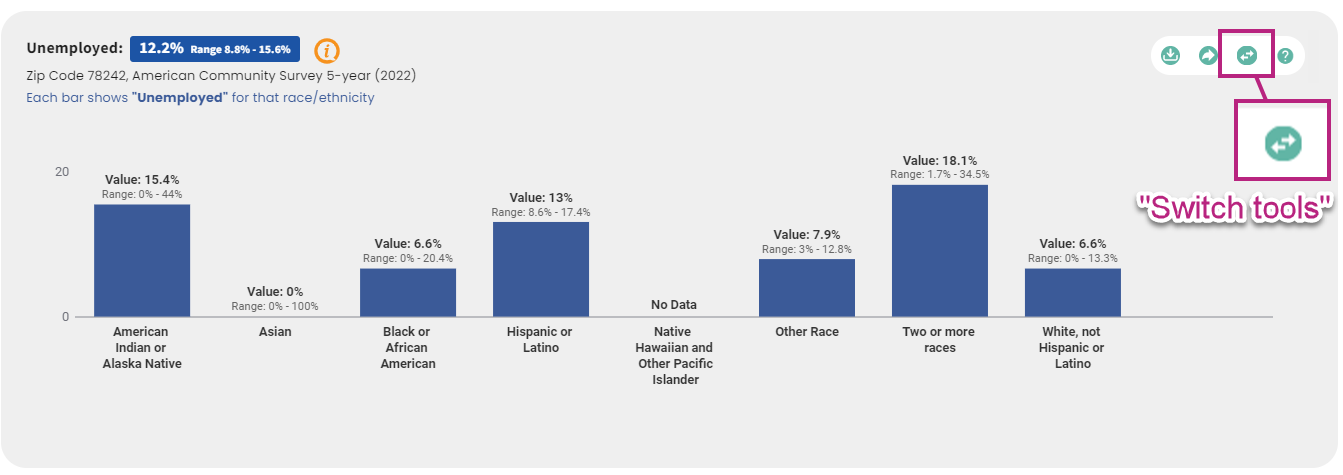
New feature alert! Now you can explore the data further with the simple click of a button! This NEW button, called “Switch Tools”, lets you switch from one tool to another (My Community, Explore Data, and Tables & Downloads) while keeping your filters intact. Simply look for the teal-green icon with two arrows next to the other primary navigation buttons (like “Download” and “Share”) and select which tool you want to switch to.
DIVE IN NOW!
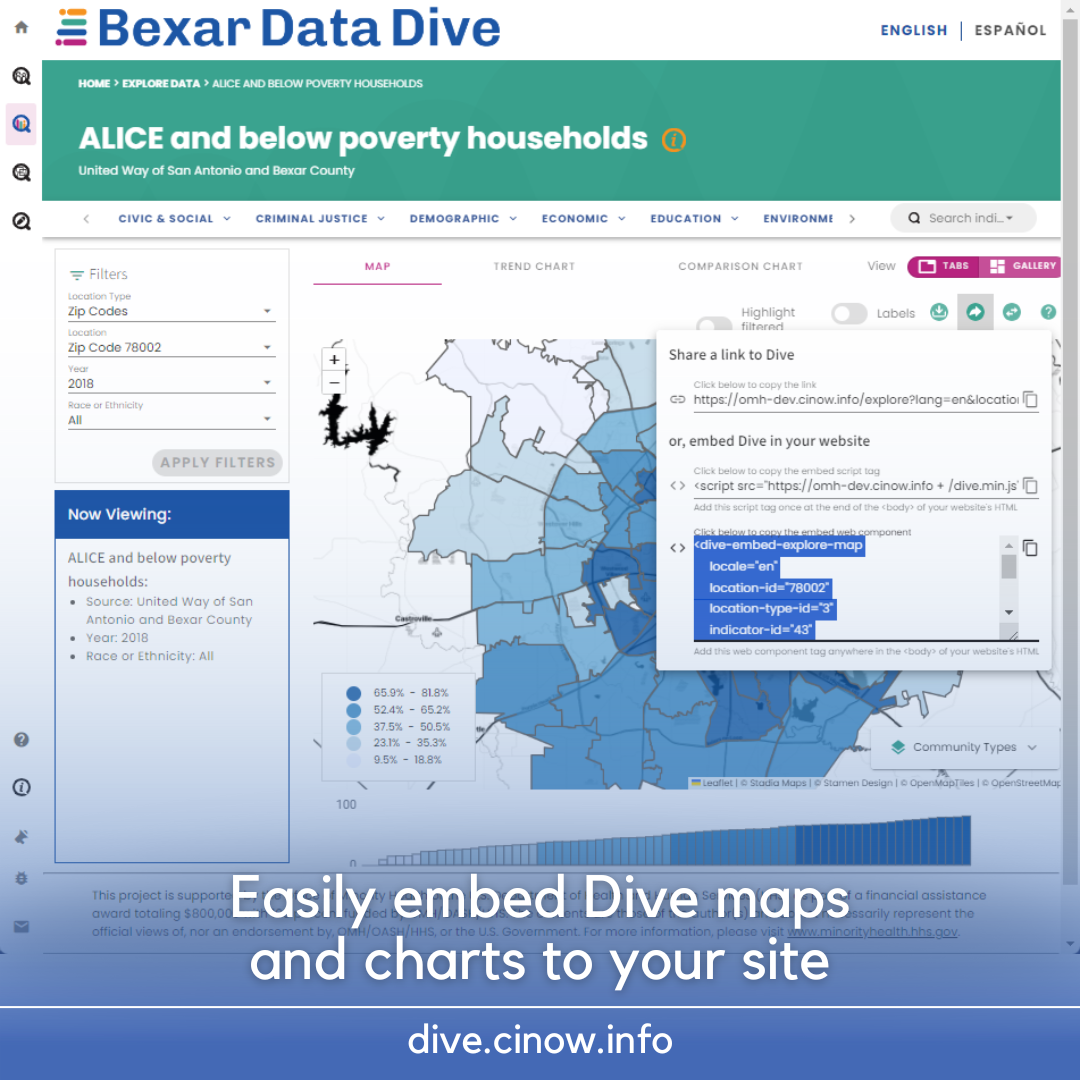
New feature alert!! We love hearing your feedback on using the Bexar Data Dive because great ideas come from it like our most recent update is called “Gallery View” on the Explore Data tool. This new feature lets you view all data visualizations side by side (the map, trend chart, and comparison chart). We also added a chart that lets you view all locations in the location type you selected from low to high. This is especially useful if you want to find the lows and highs for any given indicator without the hassle of sorting.
Take a dive now!
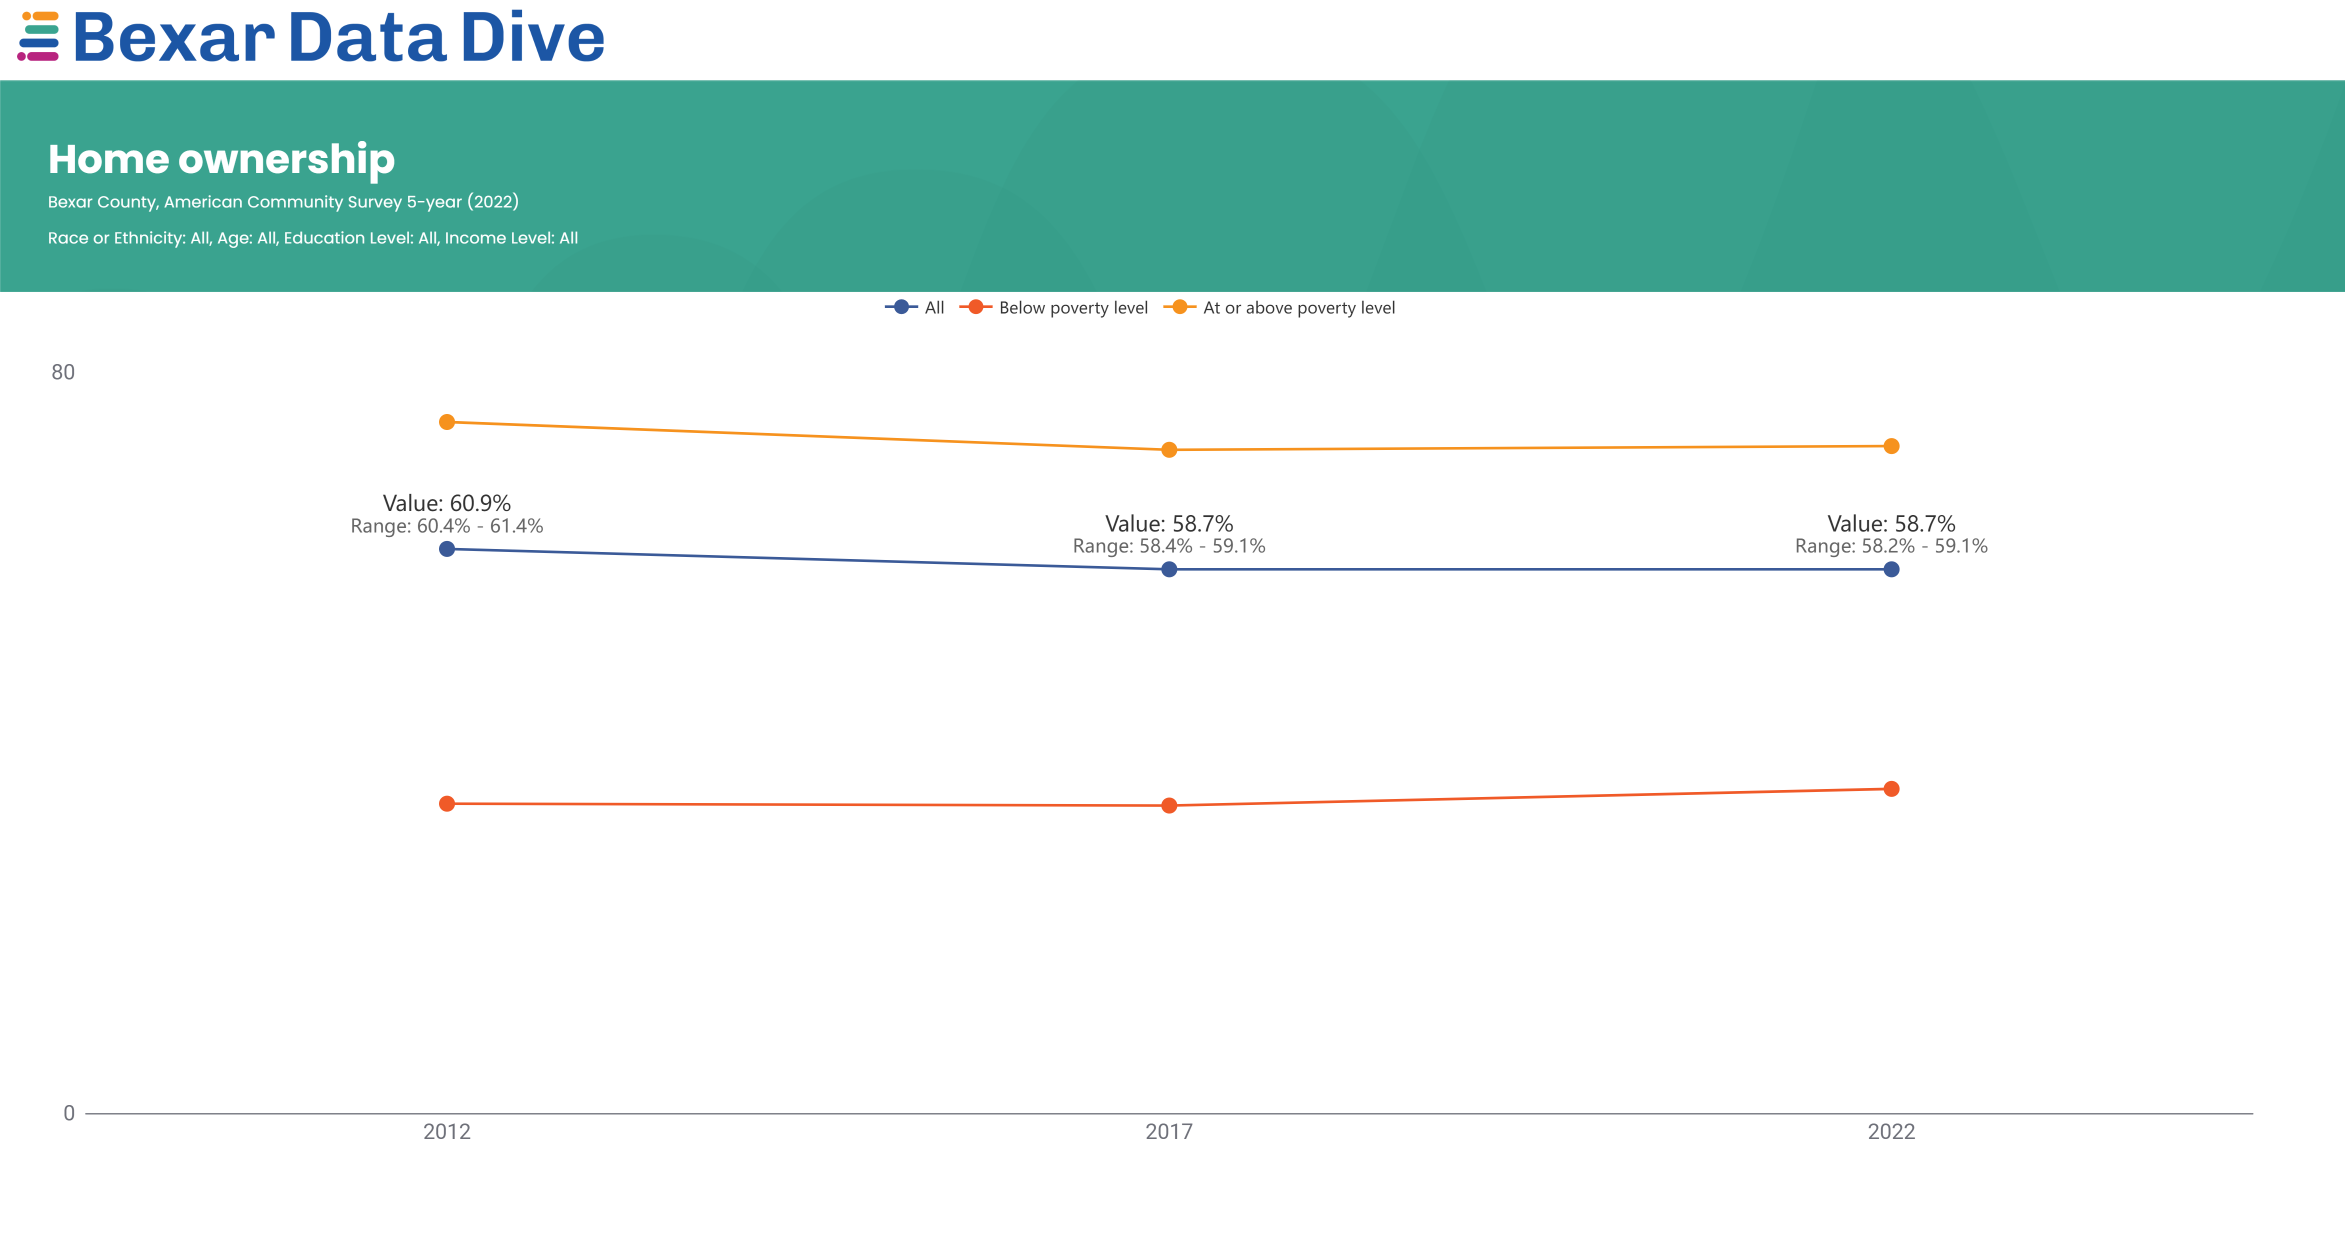
New feature alert!! You can now compare multiple trend lines on Bexar Data Dive. Select what you want to compare by (race/ethnicity, age, etc.) and what specific items you want to compare. Dive will automatically color code each of the trend lines and you can then turn labels or MOE (Margins of Error) shading on and off. As with any tool on the site, anything you create can be easily downloaded and shared!
Take a dive now!
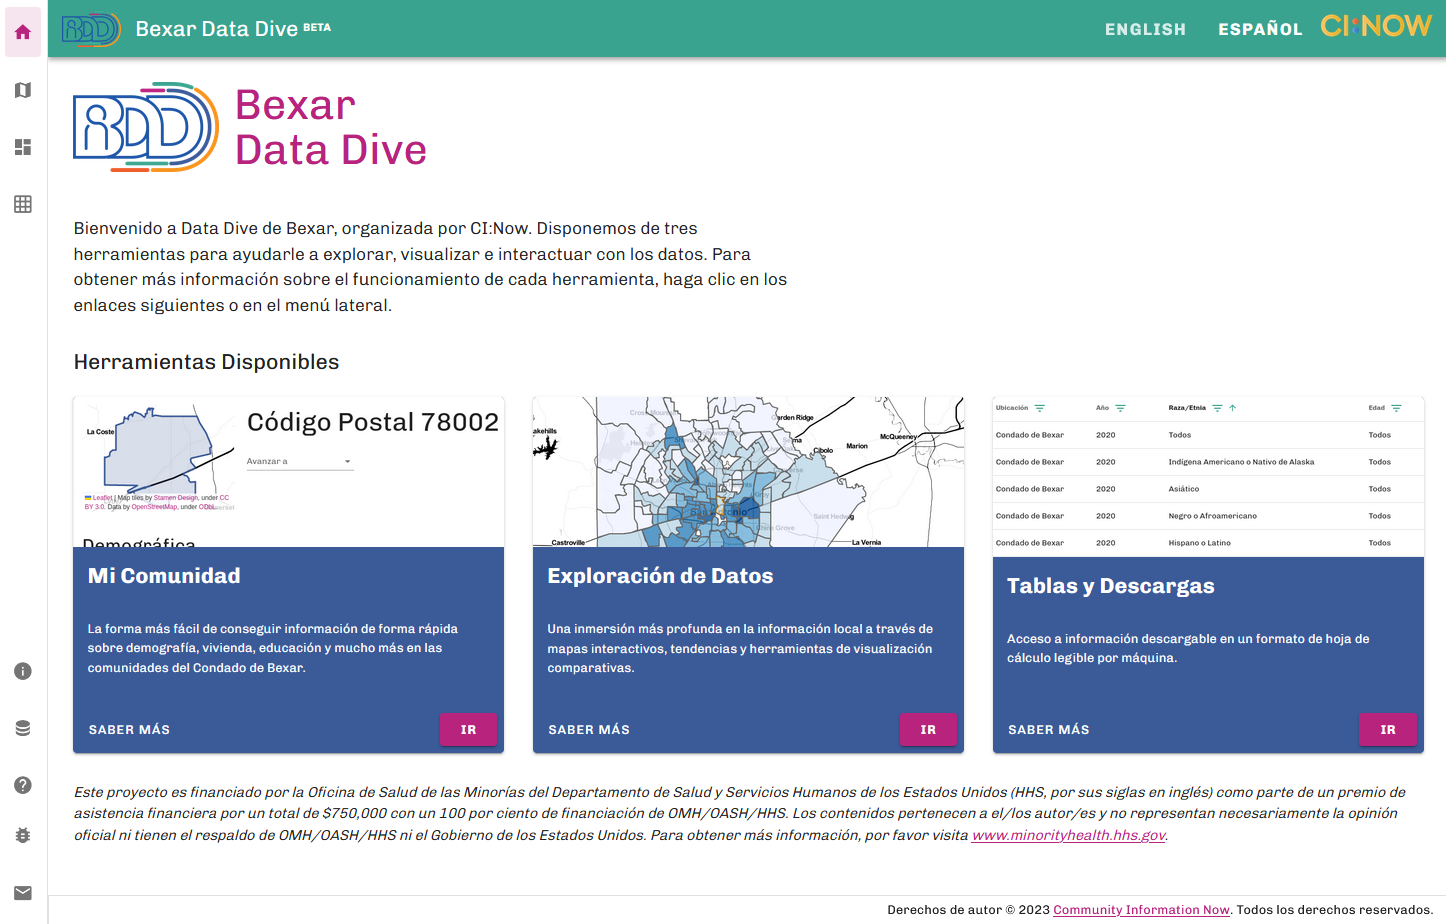
The My Community tool allows you to explore information about demographics, housing, education and much more across communities in Bexar County, TX. Communities include Council Districts, Zipcodes, Census Tracts and SSA’s, or Statistical Small Areas. SSAs are combinations of Census Tracts grouped on meaningful indicators like Race/Ethnicity, housing, age, education, and income. CI:Now created SSAs to help users analyze data in areas small enough to see meaningful differences across the county, yet large enough to yield better estimates.
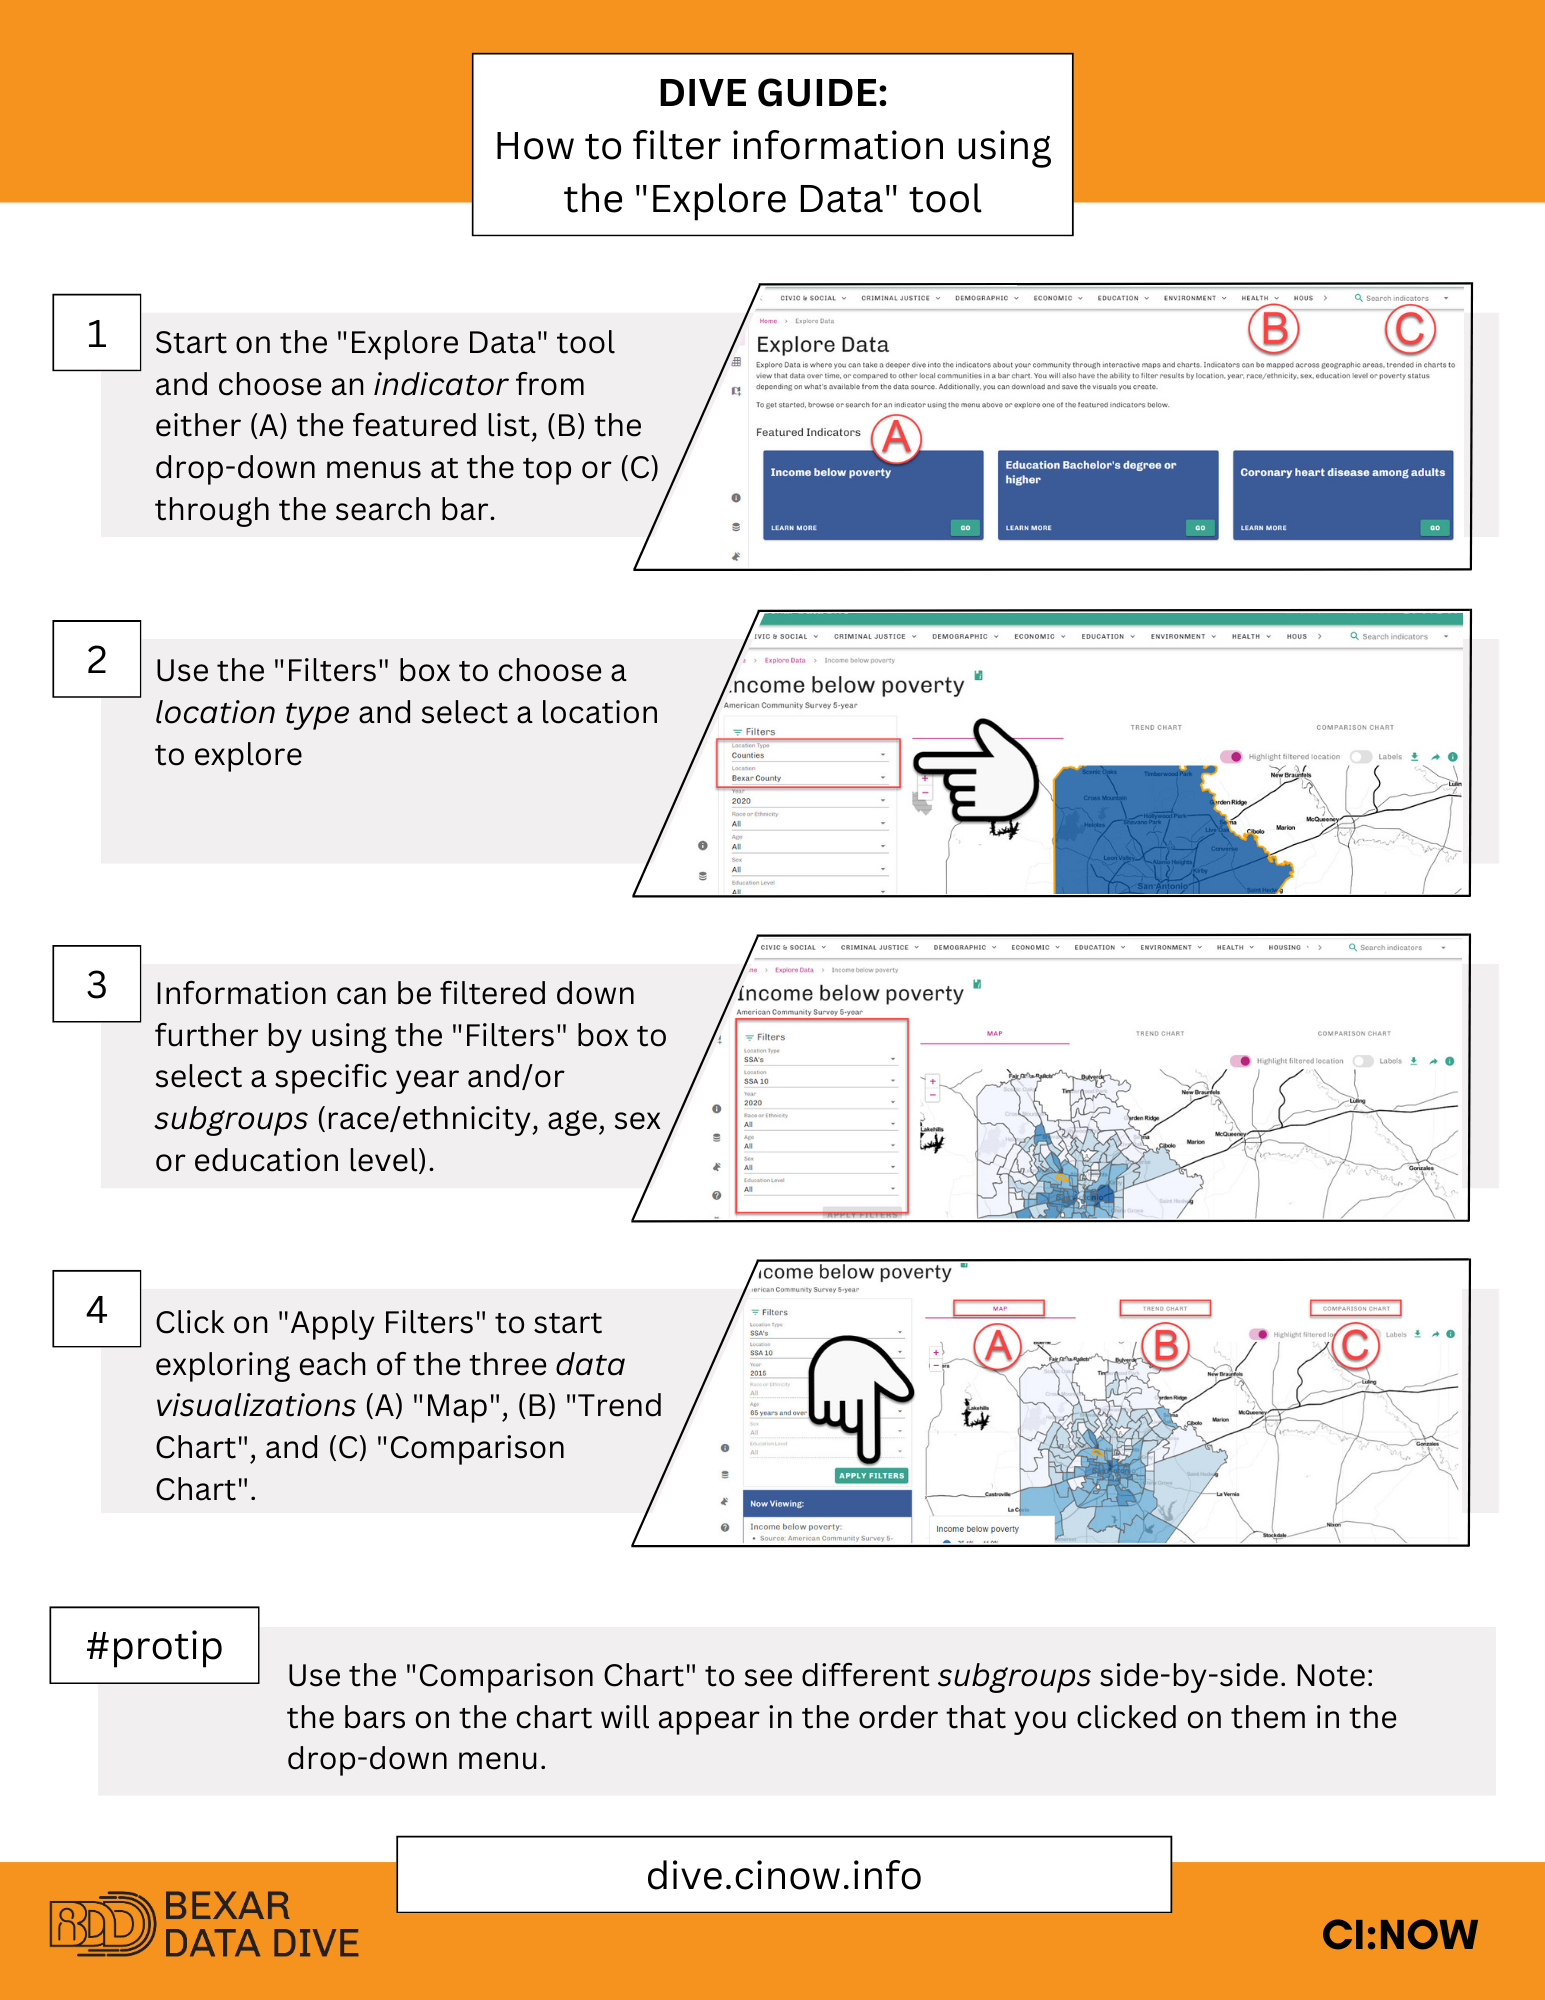
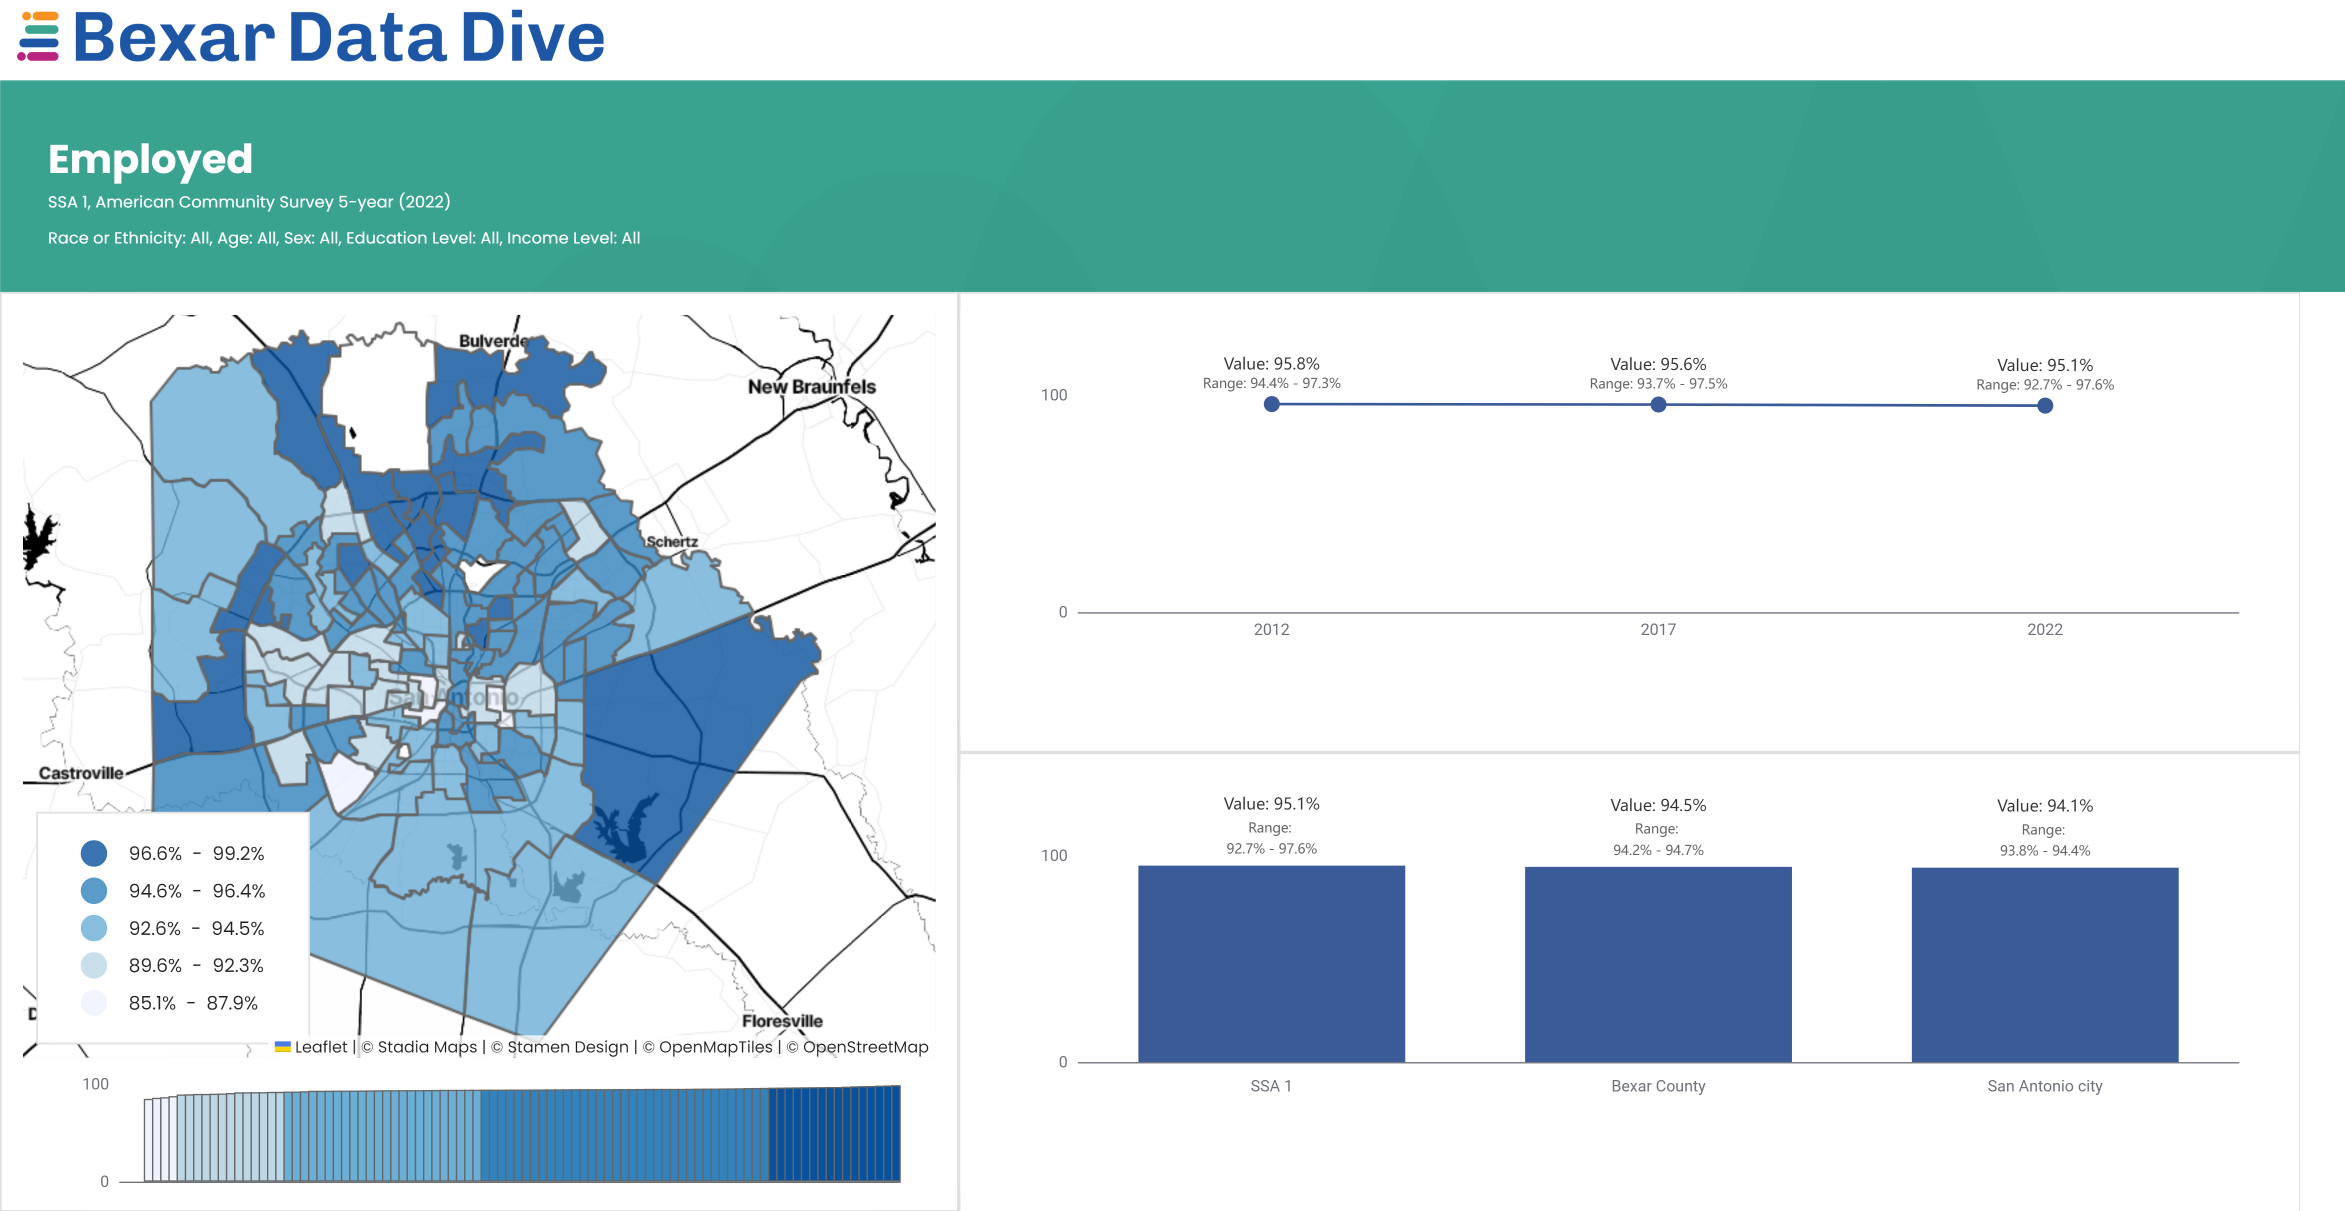
Explore Data is a tool where you can take a deeper dive into the indicators about your community in Bexar County, TX through interactive maps and charts. Indicators can be mapped across geographic areas, trended in charts to view that data over time, or compared to other local communities in a bar chart. You will also have the ability to filter results by location, year, race/ethnicity, sex, education level or poverty status depending on what’s available from the data source. Additionally, you can download and save the visuals you create.
The Bexar Data Dive Create Your Own Area tool is where you can build your own geographies. Create as many custom areas as you would like using SSAs, Council Districts, Zipcodes and Census tracts as the building blocks. Once created, users can explore and visualize data for their custom area(s) with Bexar Data Dive. Custom areas can be saved within your browser or downloaded for future use.
Tables & Downloads is a tool where you can access data for Bexar County, TX in a machine-readable spreadsheet format to use in your own data processing and visualization tools. You can filter the data by location, year, race/ethnicity, education level or poverty status, depending on what is available from the data source, download and save the data tables you create.
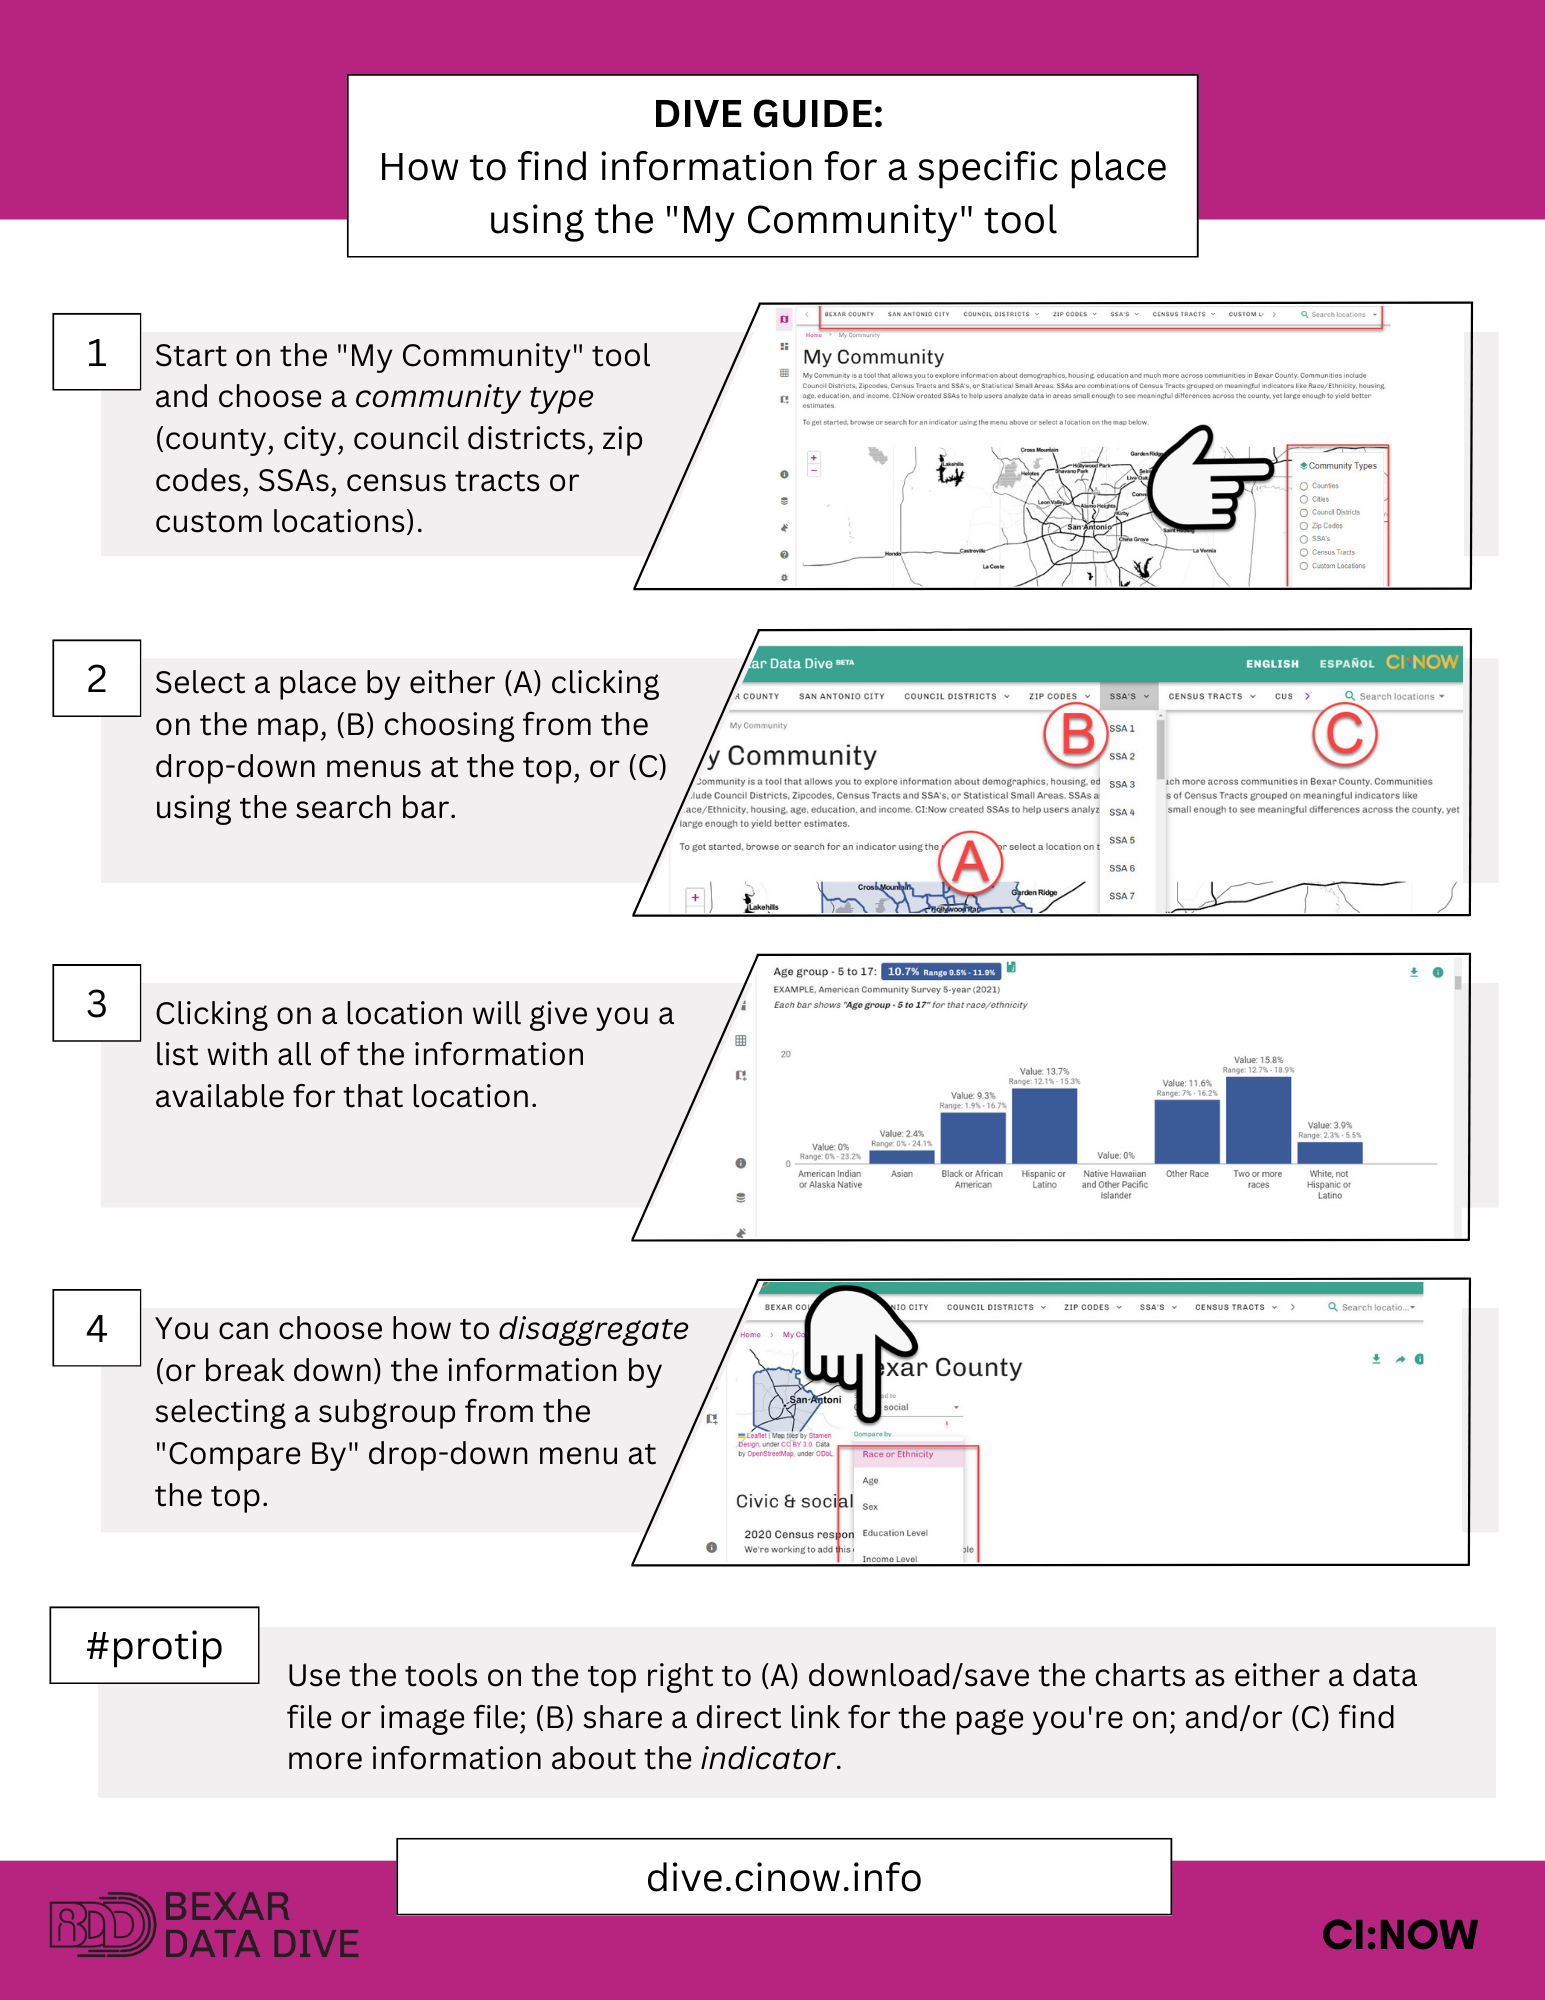
How To Find Information For a Specific Place Using “My Community”
Available in English and Español
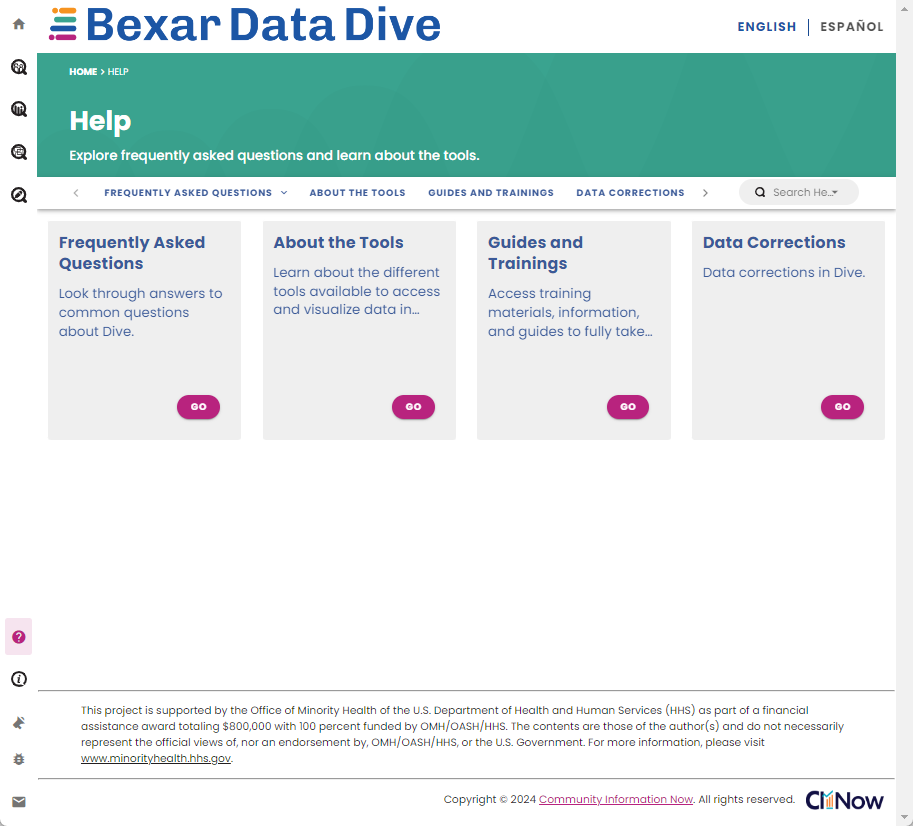
Frequently Asked Questions
Explore our help content, visit the page for frequently asked questions, to learn about the tools and find data correction notes.
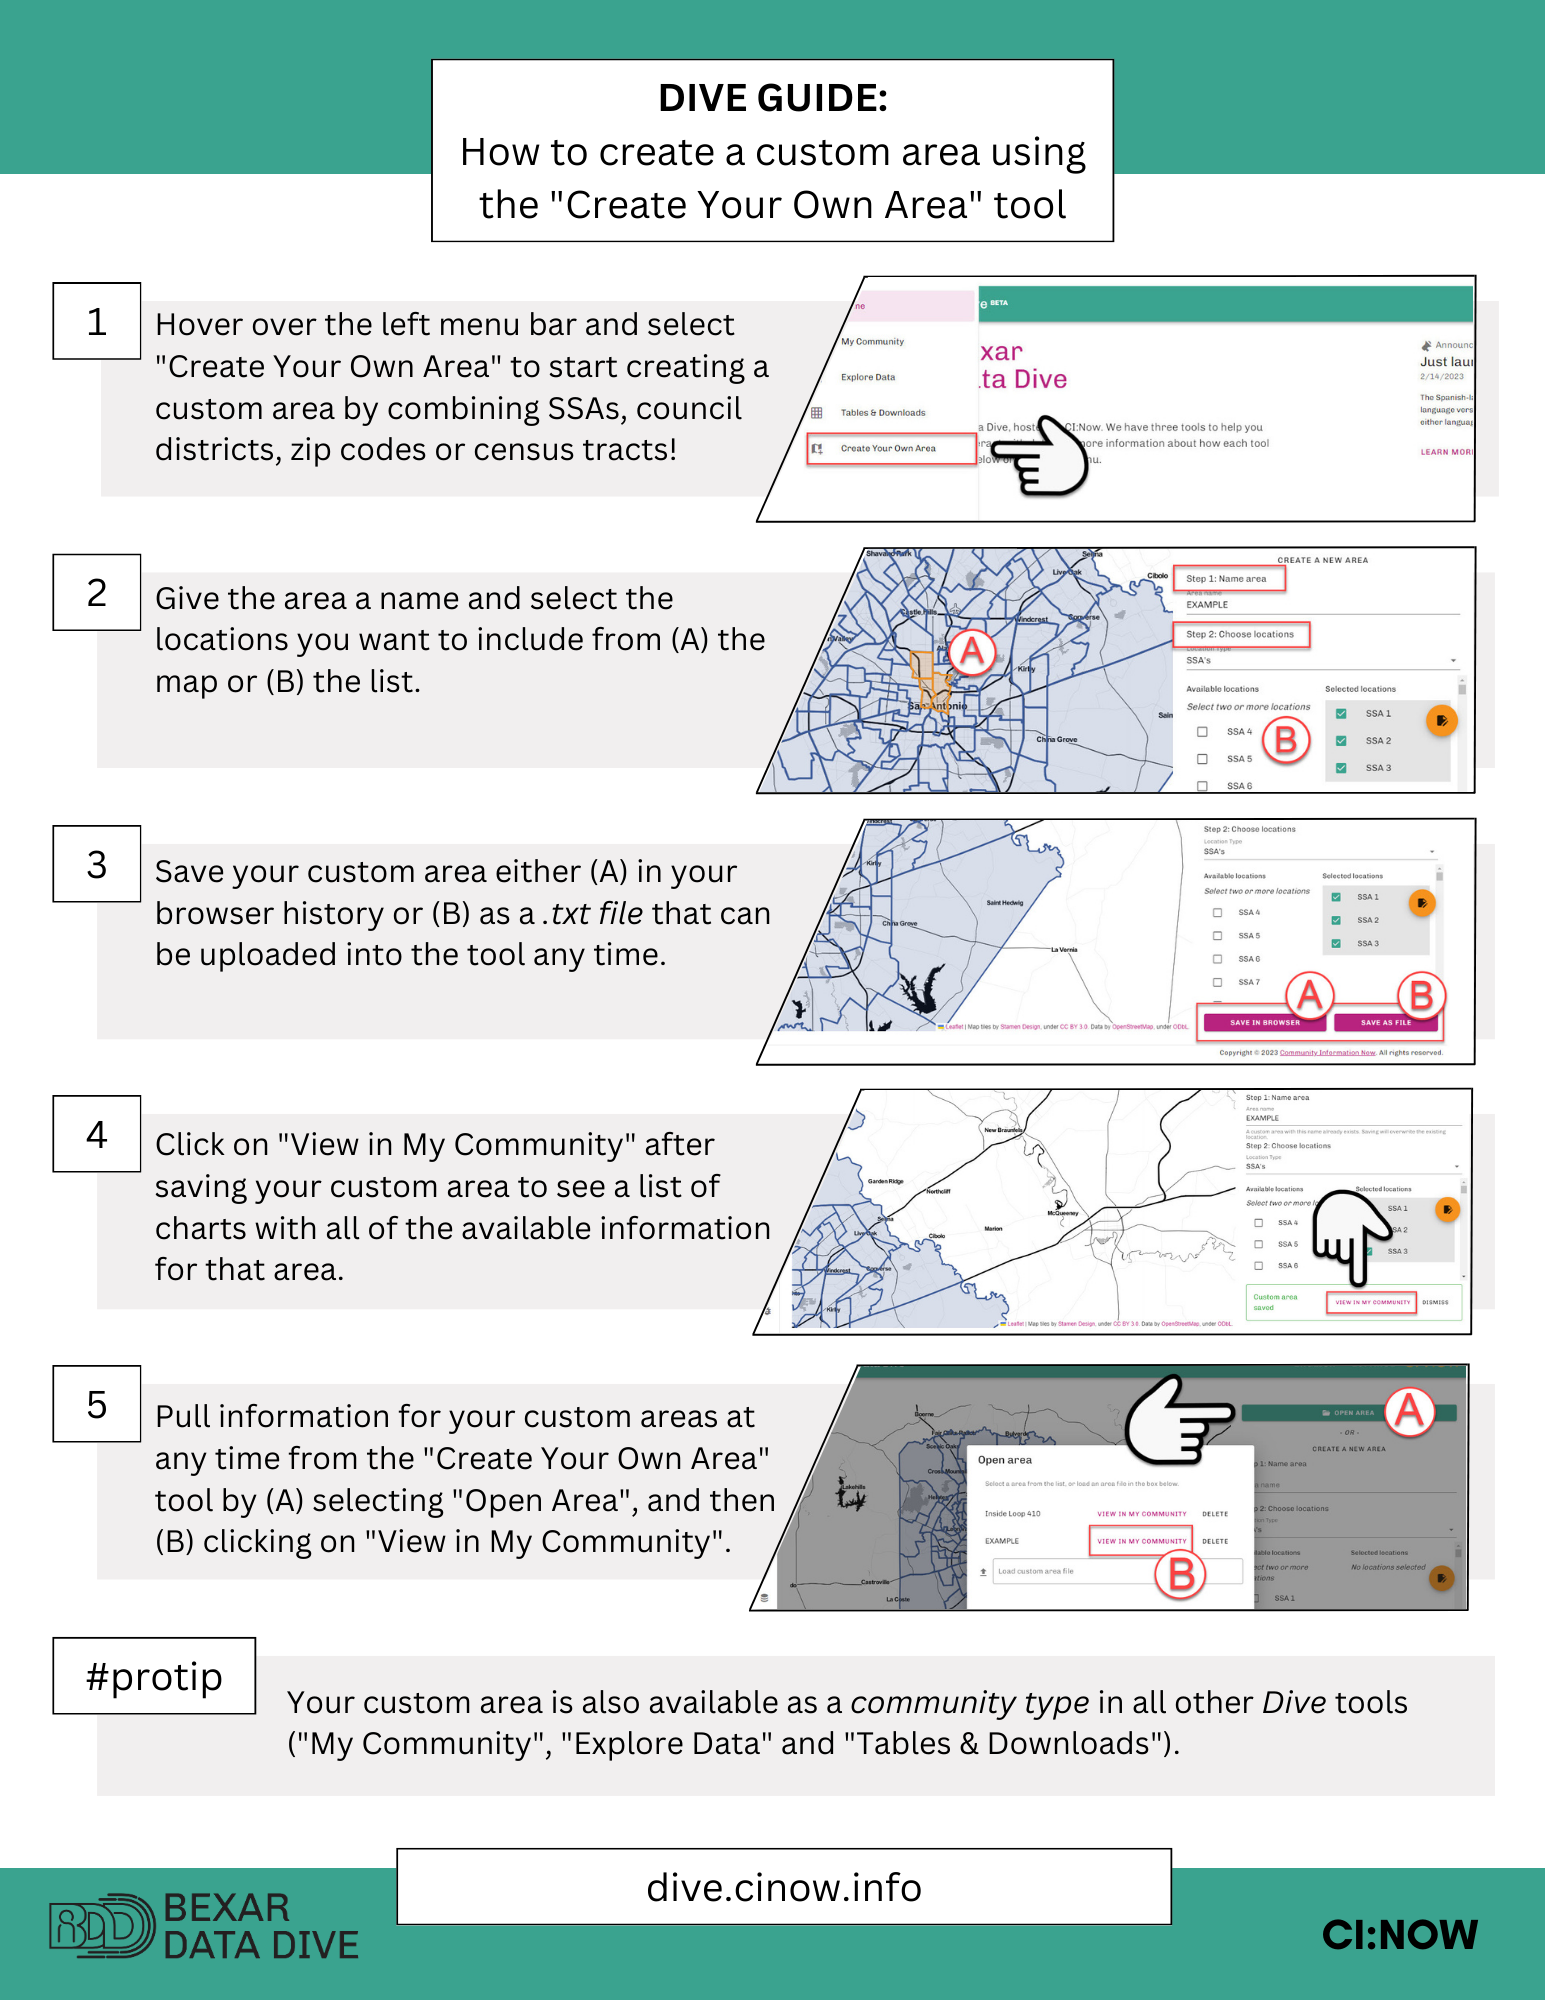
How To Create a Custom Area Using “Create Your Own Area”
Available in English and Español