In fall 2020 CINow compiled and correlated COVID-19 and social determinants of health (SDOH) data to shed light on differences in how COVID-19 is affecting Bexar County neighborhoods and groups of people in terms of health, income, employment and business, housing, and other issues. The COVID-19 & Existing Disparities tool also shows how the pandemic is worsening (or just changing) the inequity and injustice already shouldered by marginalized communities.
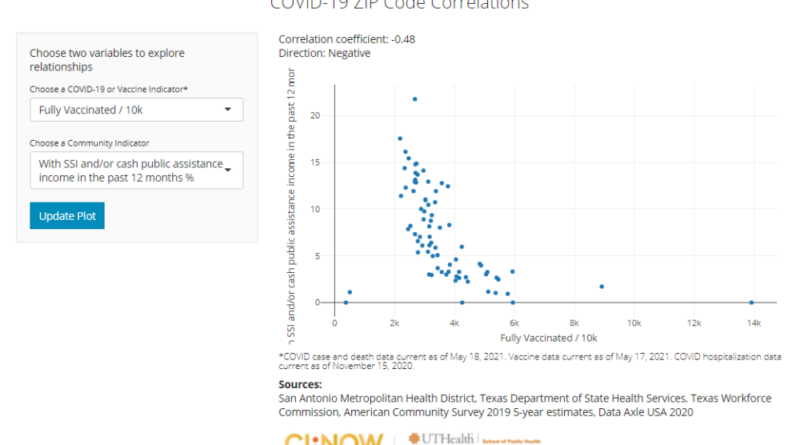
CINow has just added vaccination data by ZIP code and updated the case and death data. (Hospitalization data is still as of November 2020.) The vaccination data includes single-dose, fully vaccinated, and total doses per 10,000 population. The image above shows a moderate negative (inverse) correlation or relationship at the ZIP code level between rate of fully-vaccinated and percent of households with SSI and/or cash assistance in the past 12 months.
View a brief video for help using the tool.
If you think this work matters, please consider donating to support local data capacity.