Local data that’s relevant, trustworthy, and timely.
Featured tools
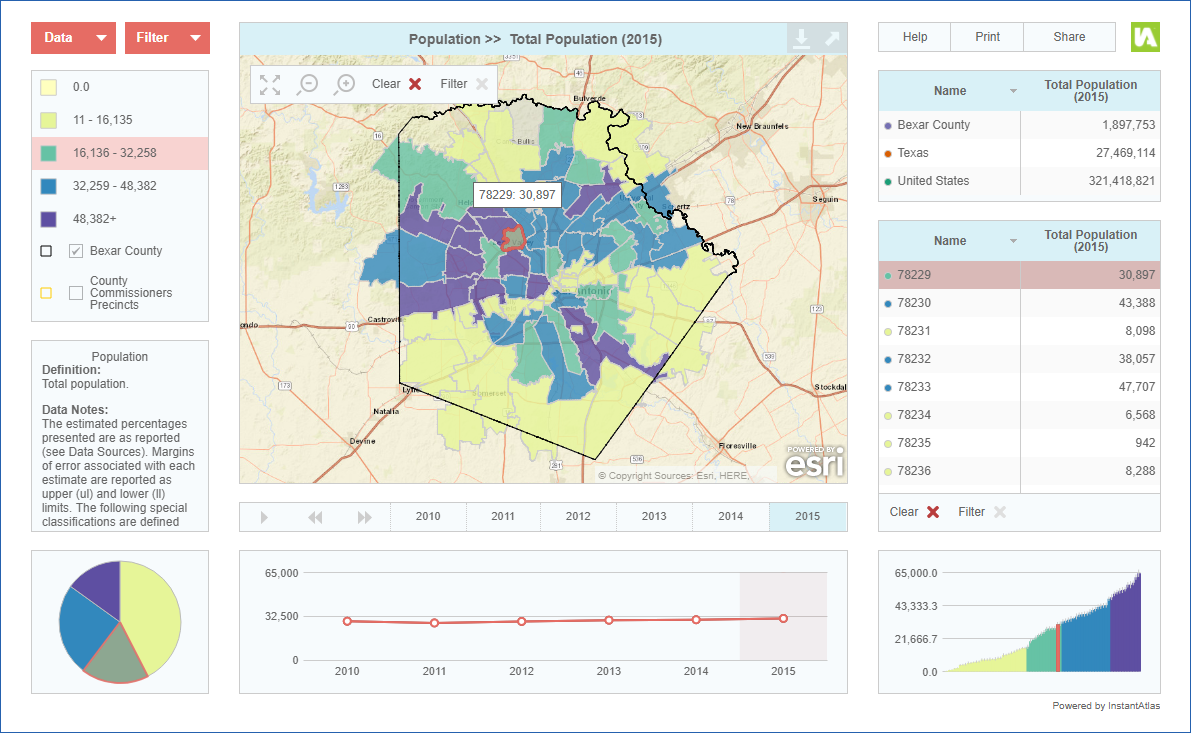
The Viz-a-lyzer maps and trends dozens of indicators for Bexar Co. zip code tabulation areas (ZCTAs) with comparison data for the county, Texas, and the U.S. Embed the visualization in your website, or export all or part of the visualization and drop the image right into your document.
Level: Easy
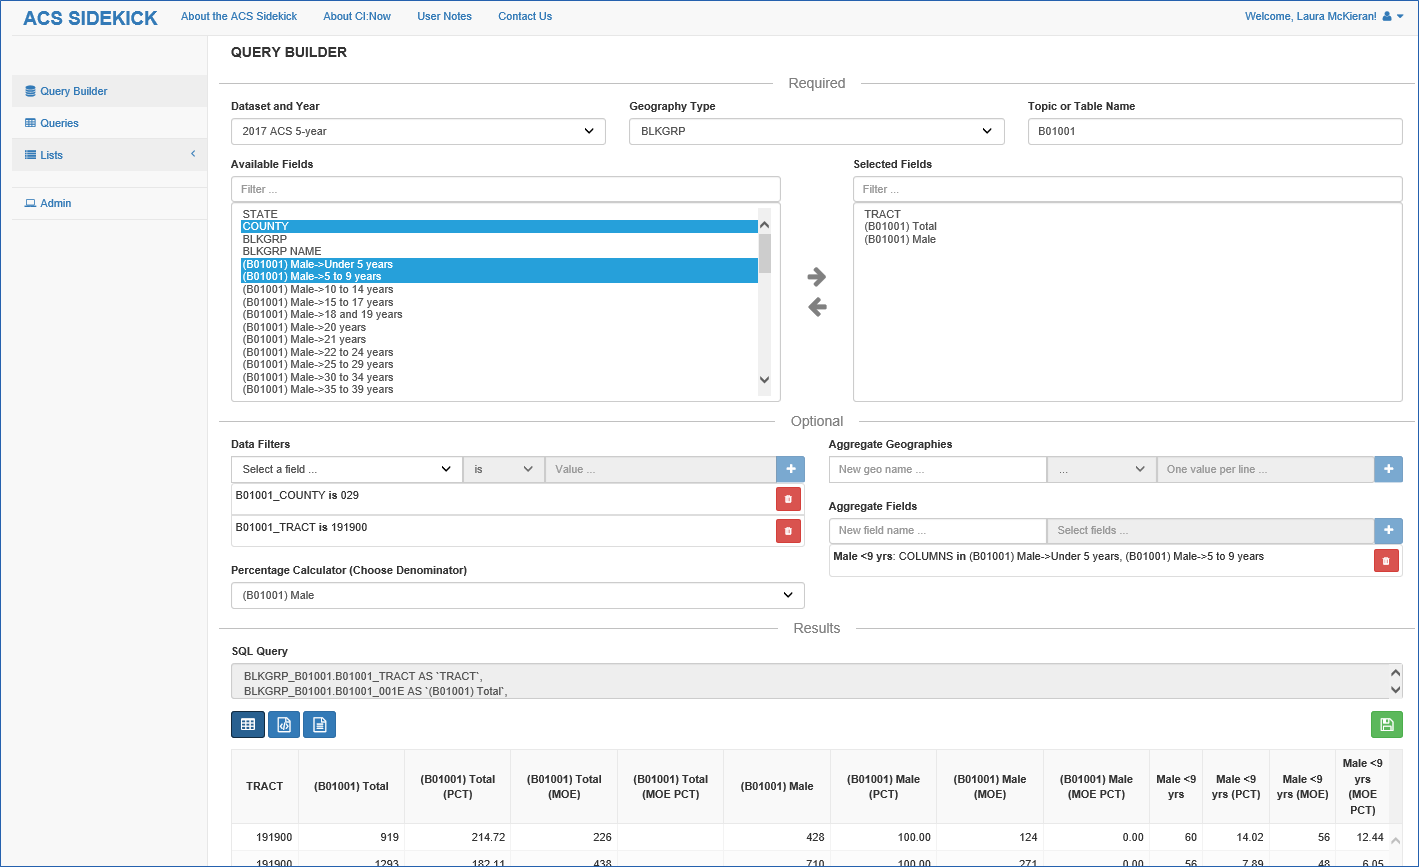
The ACS Sidekick tool makes Texas five-year estimate data from the Census American Community Survey much faster and easier to process. It calculates aggregate estimates and margins of error on the fly and lets you save and reuse queries and custom sets of values.
Level: Intermediate
Other resources
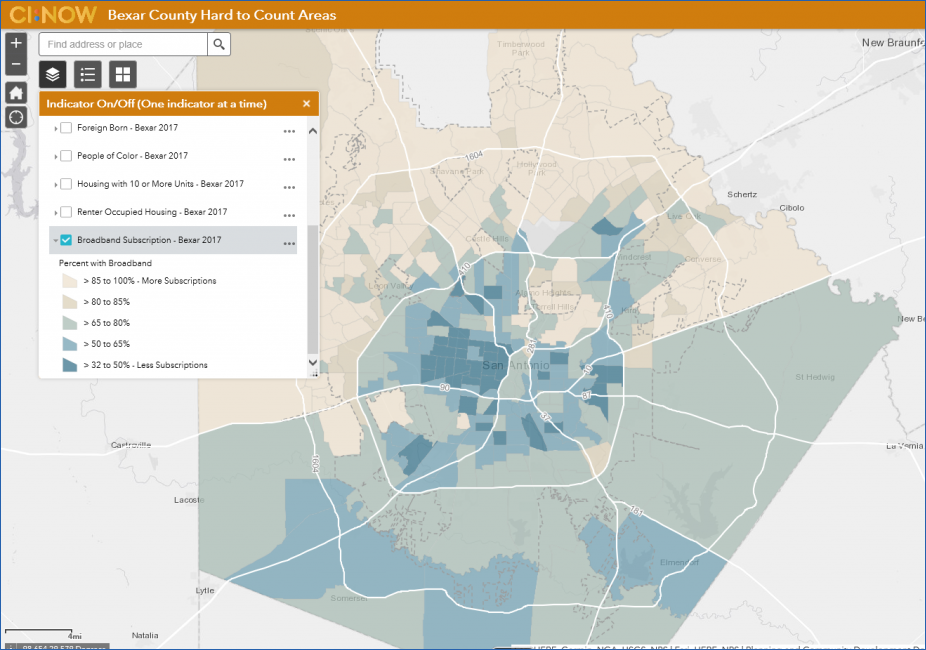
The 2020 Census Hard-to-Count Map shows neighborhoods where targeted outreach is likely needed to ensure a 2020 Census complete count.
Read more
Level: Easy
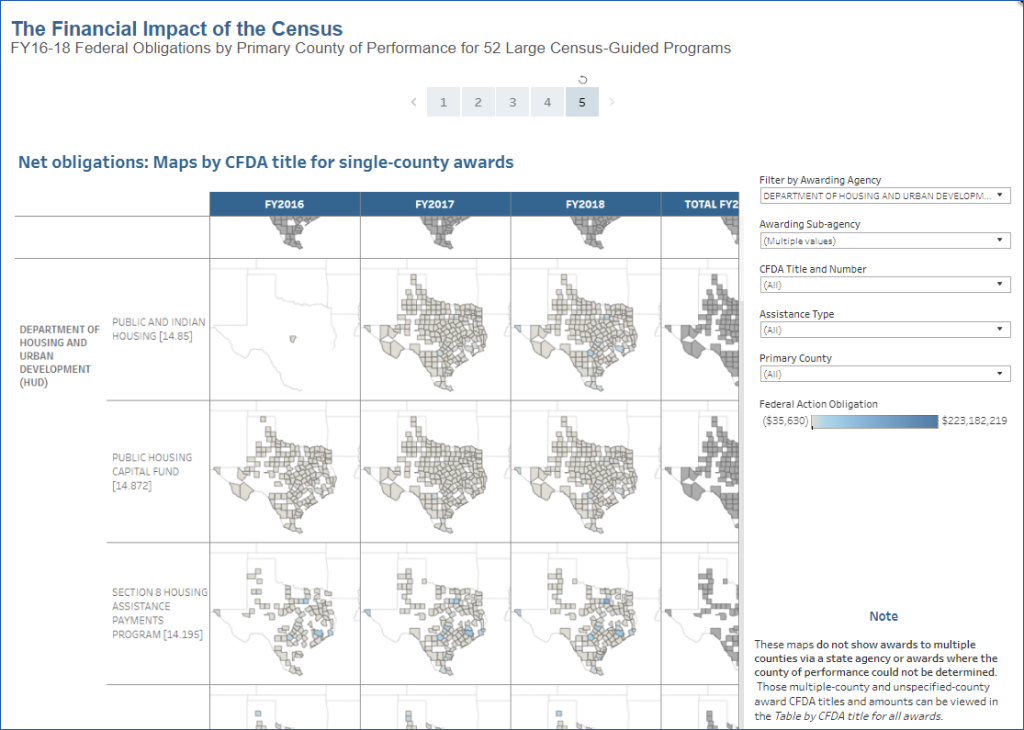
The Financial Impact of the Census visualization gives the user a sense of the scale of federal assistance to Texas driven by the Census
Read more
Level: Easy
Partnerships

The Health Collaborative’s 2019 Bexar and Atascosa Counties Community Health Needs Assessment (CHNA) includes county-, sector-,
Read more
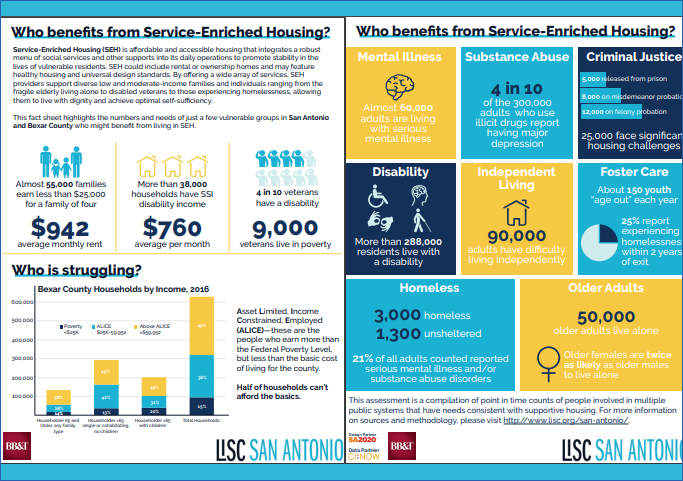
CI:Now and SA2020 partnered with LISC San Antonio to develop an infographic sheet with data about vulnerable populations who’d likely benefit
Read more
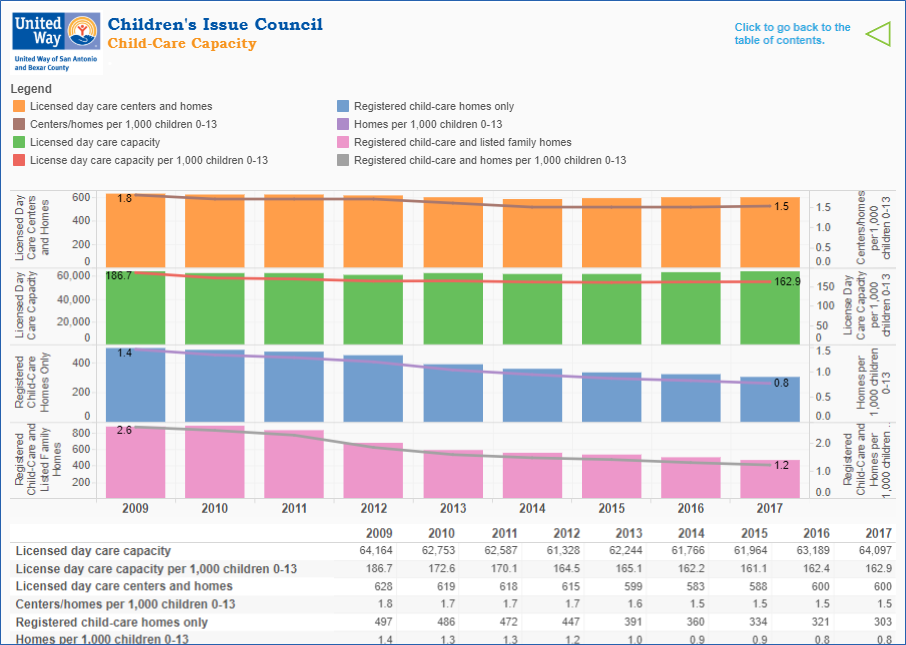
The United Way of San Antonio and Bexar County Ready Children Impact Council’s Child Data Dashboard visualizes county-level patterns
Read more
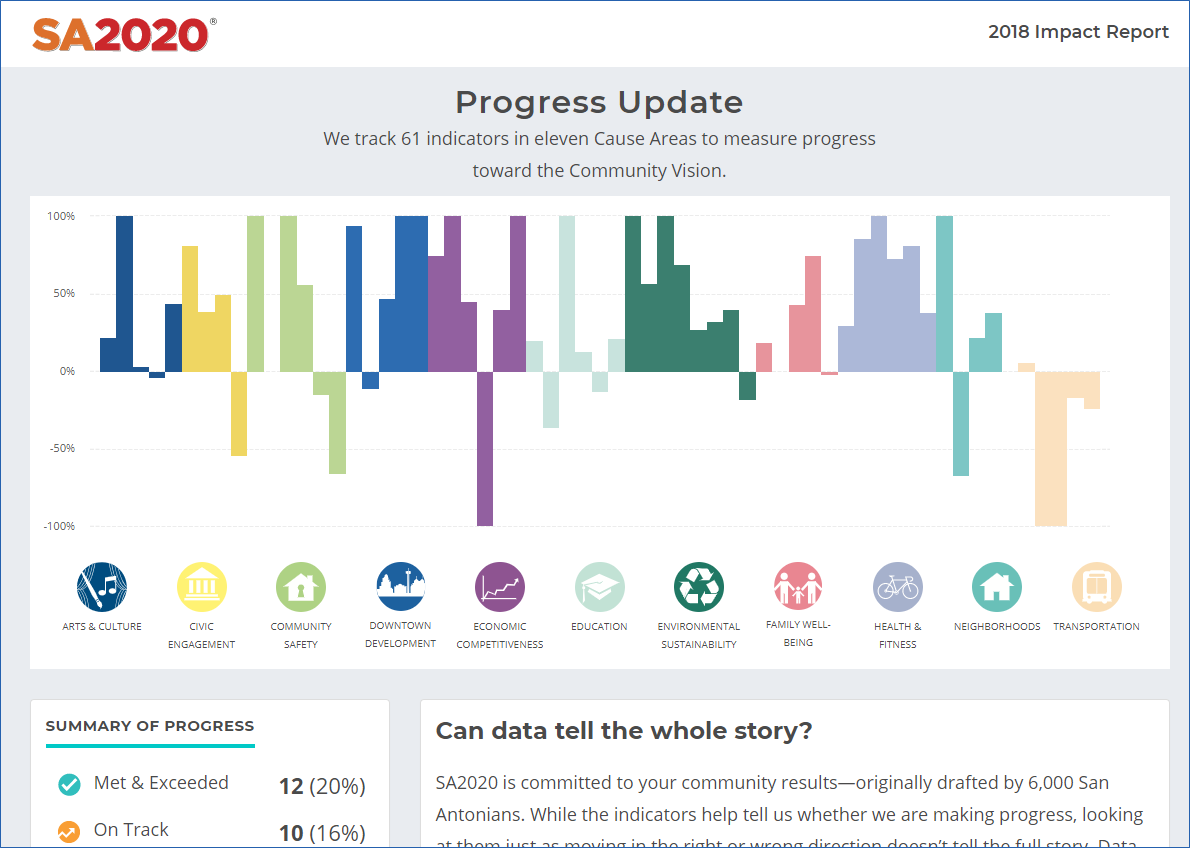
CI:Now provides the data for SA2020’s Progress Dashboard, calculating the indicators and aggregating the data to custom geographies
Read more